Skip to content
Essencial

No. 043 Energy · biomass Electricity in Brazil 2/3

Power plants by source

Water, wind, sun and fire

Record, downloads and citation
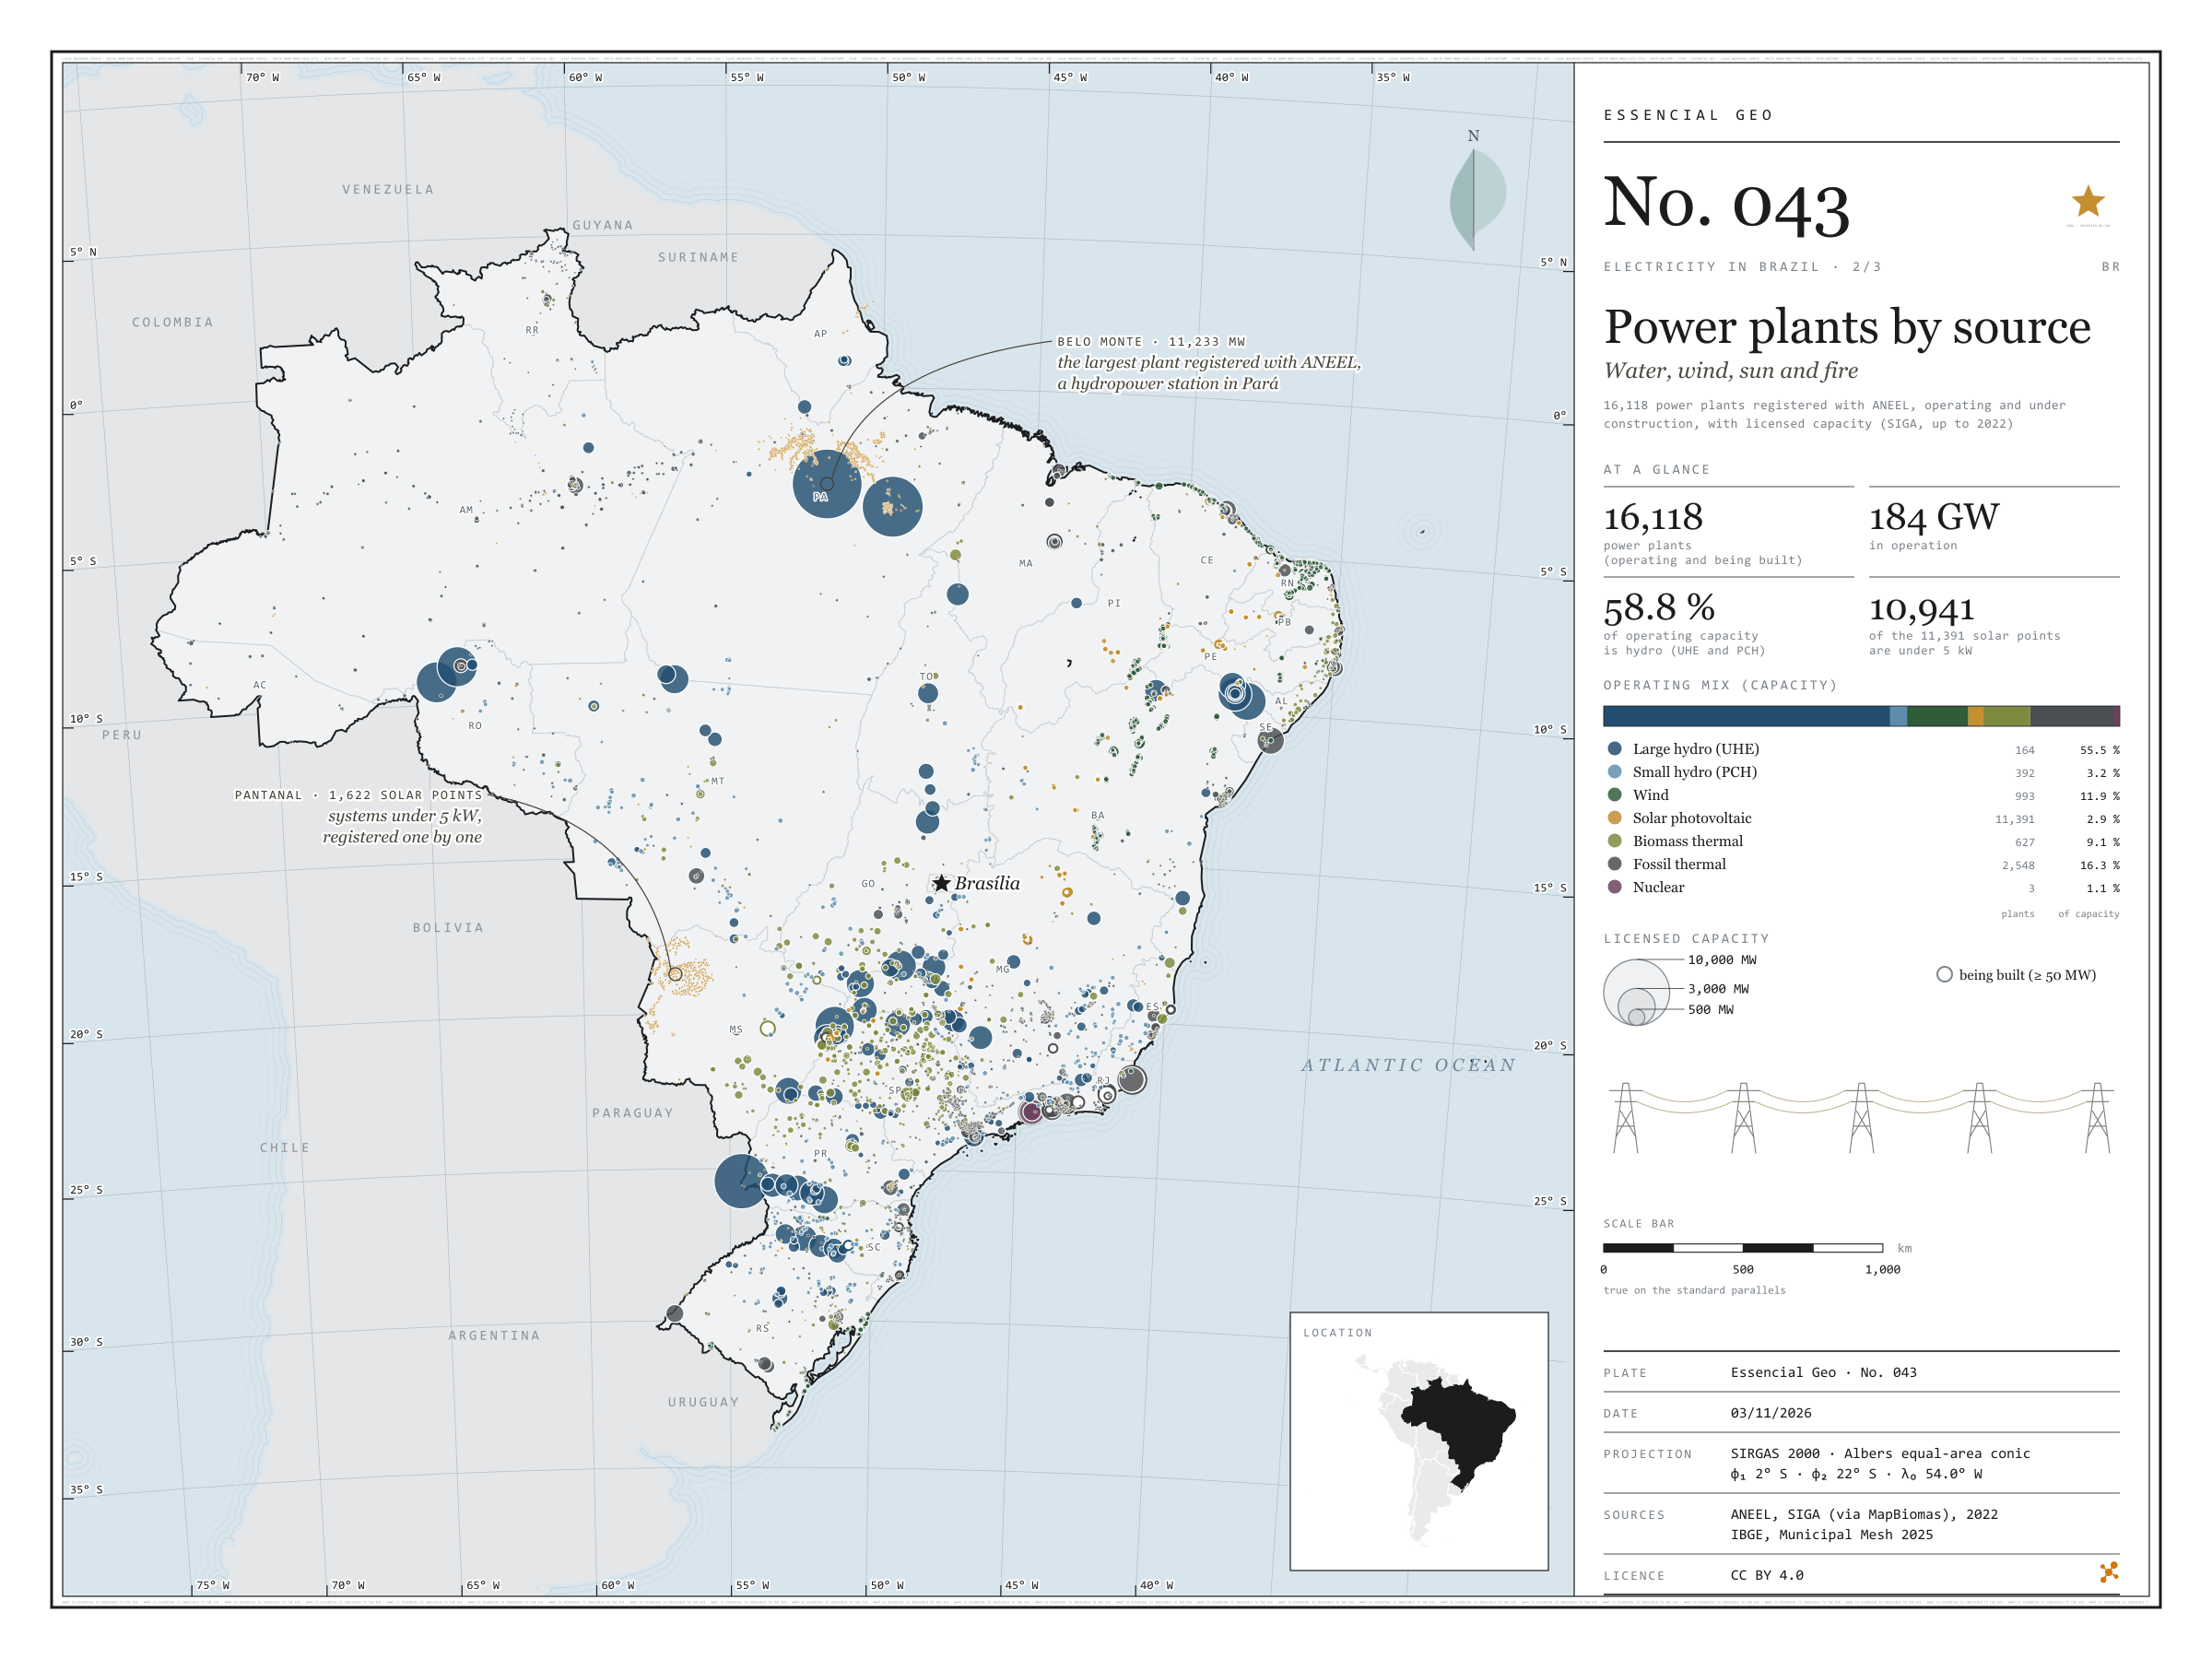
Fig. 043 Brazil EPSG:4674 Source: ANEEL, IBGE, Natural Earth

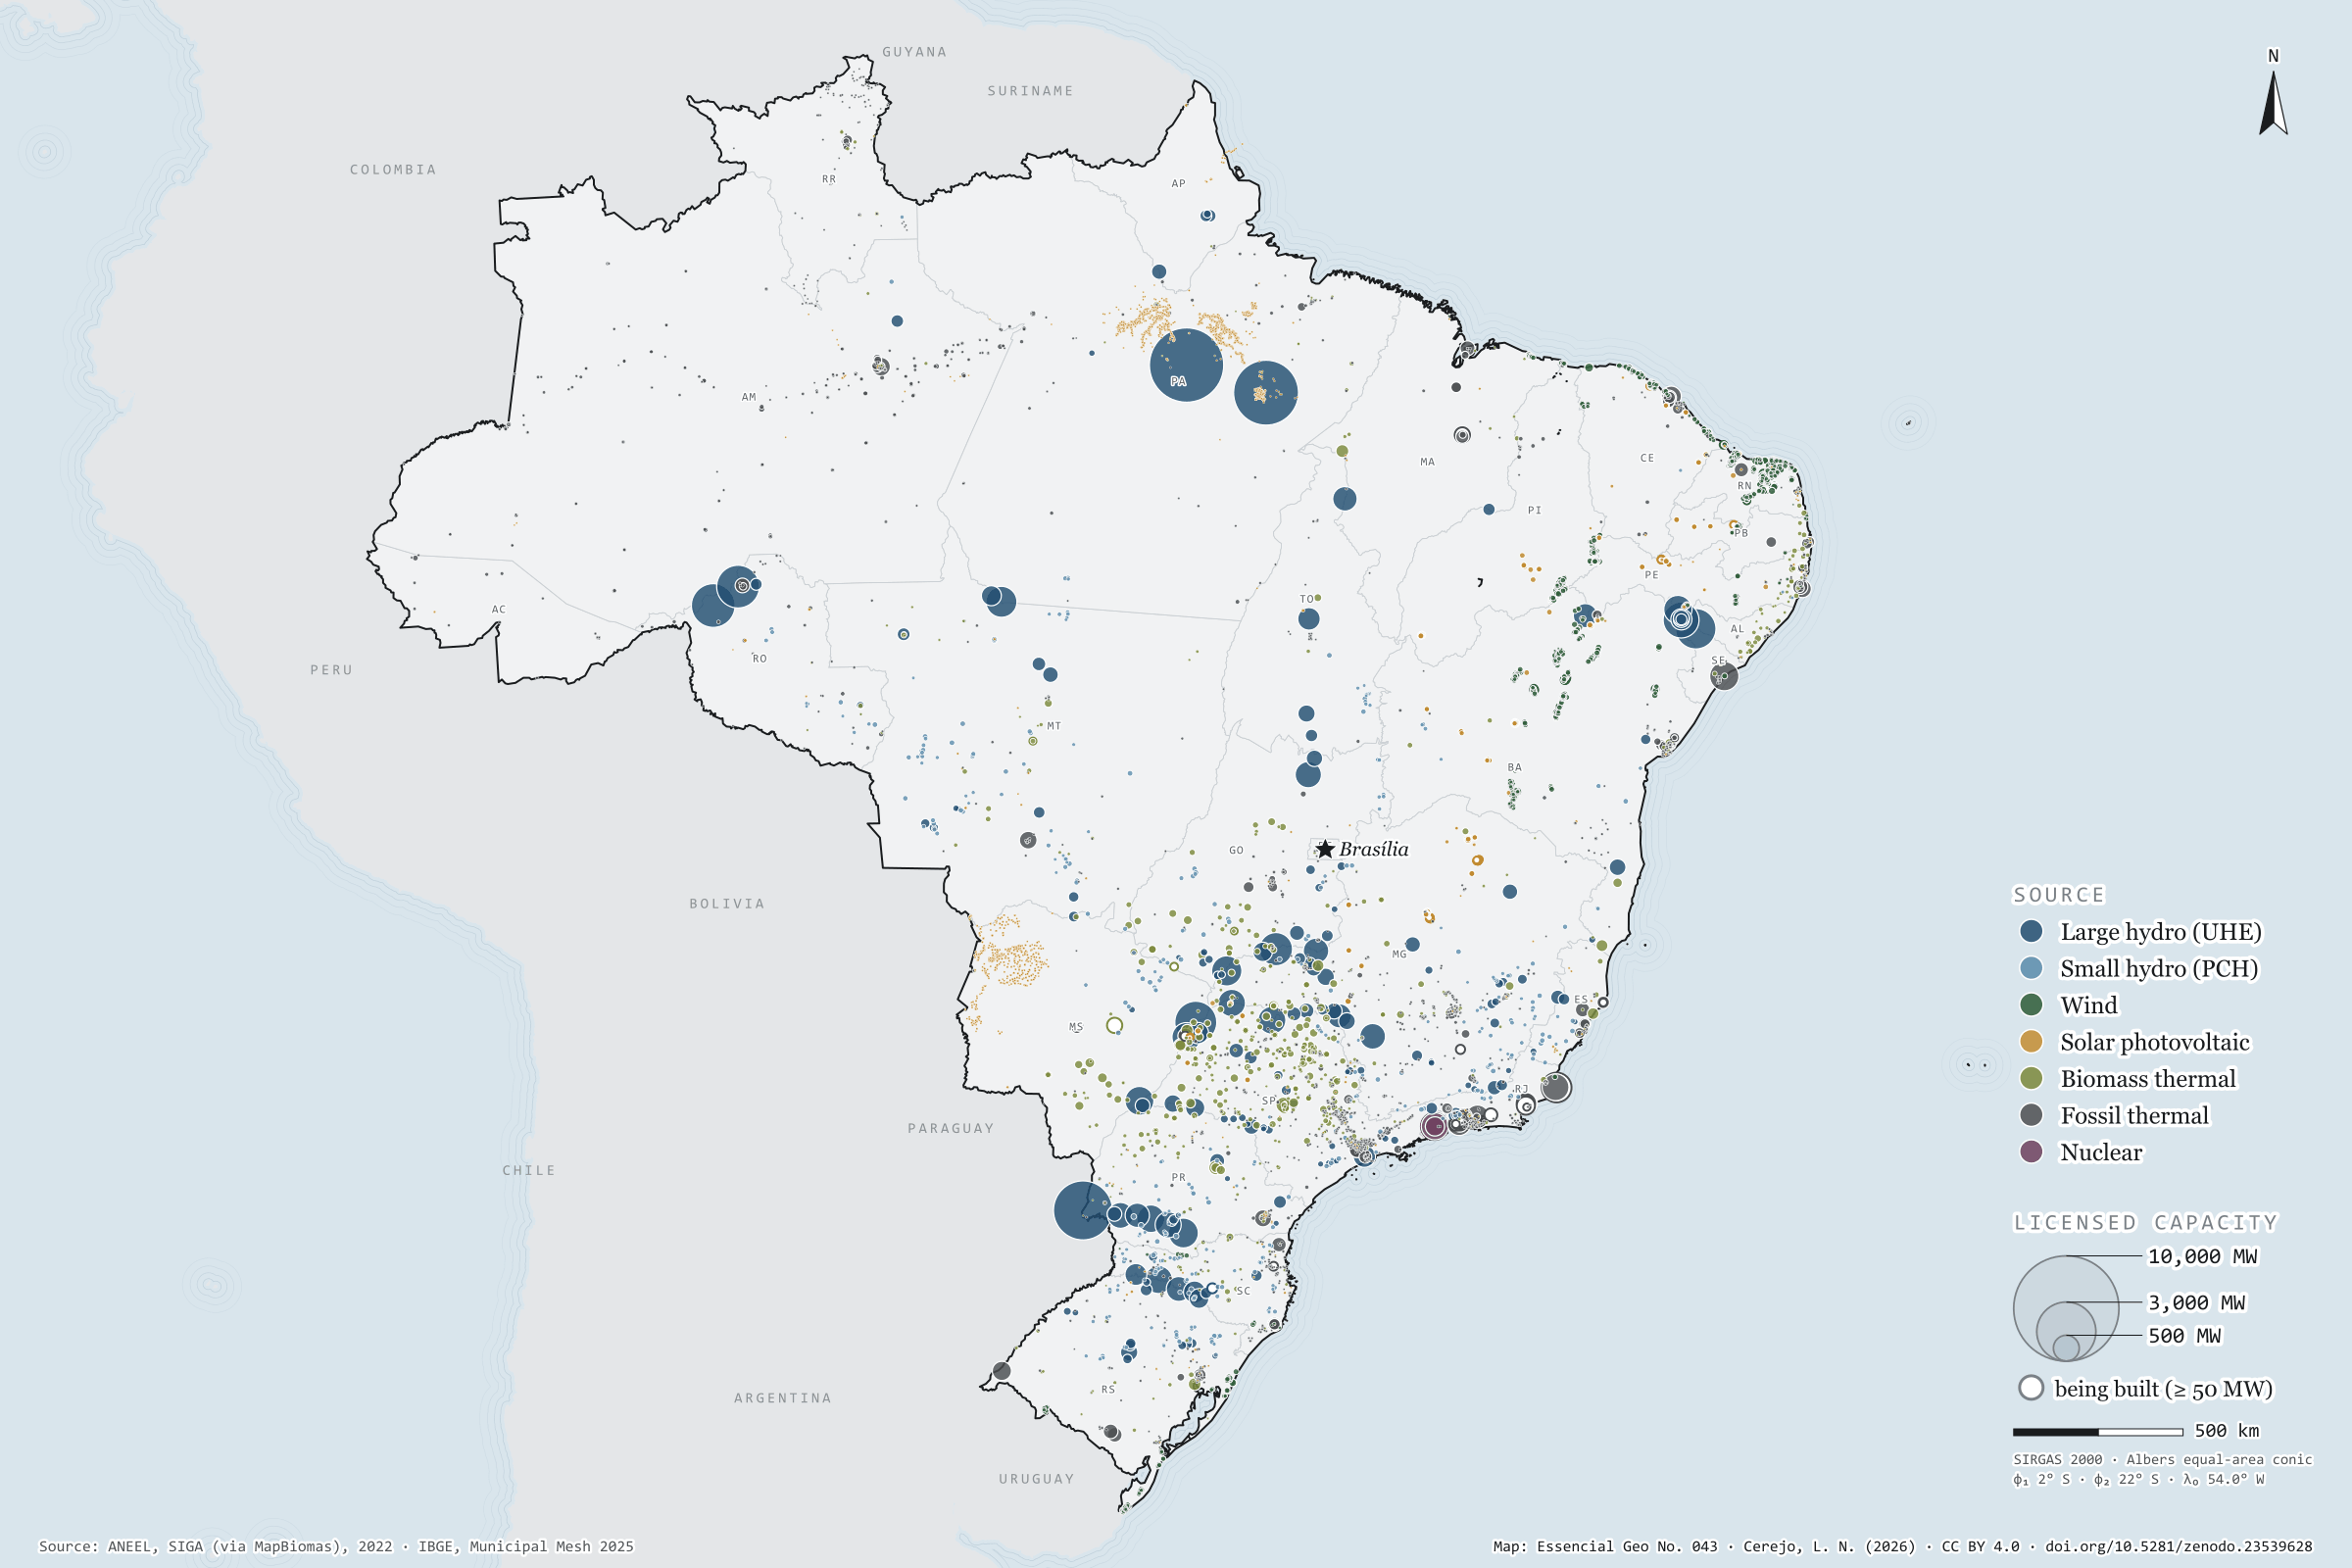
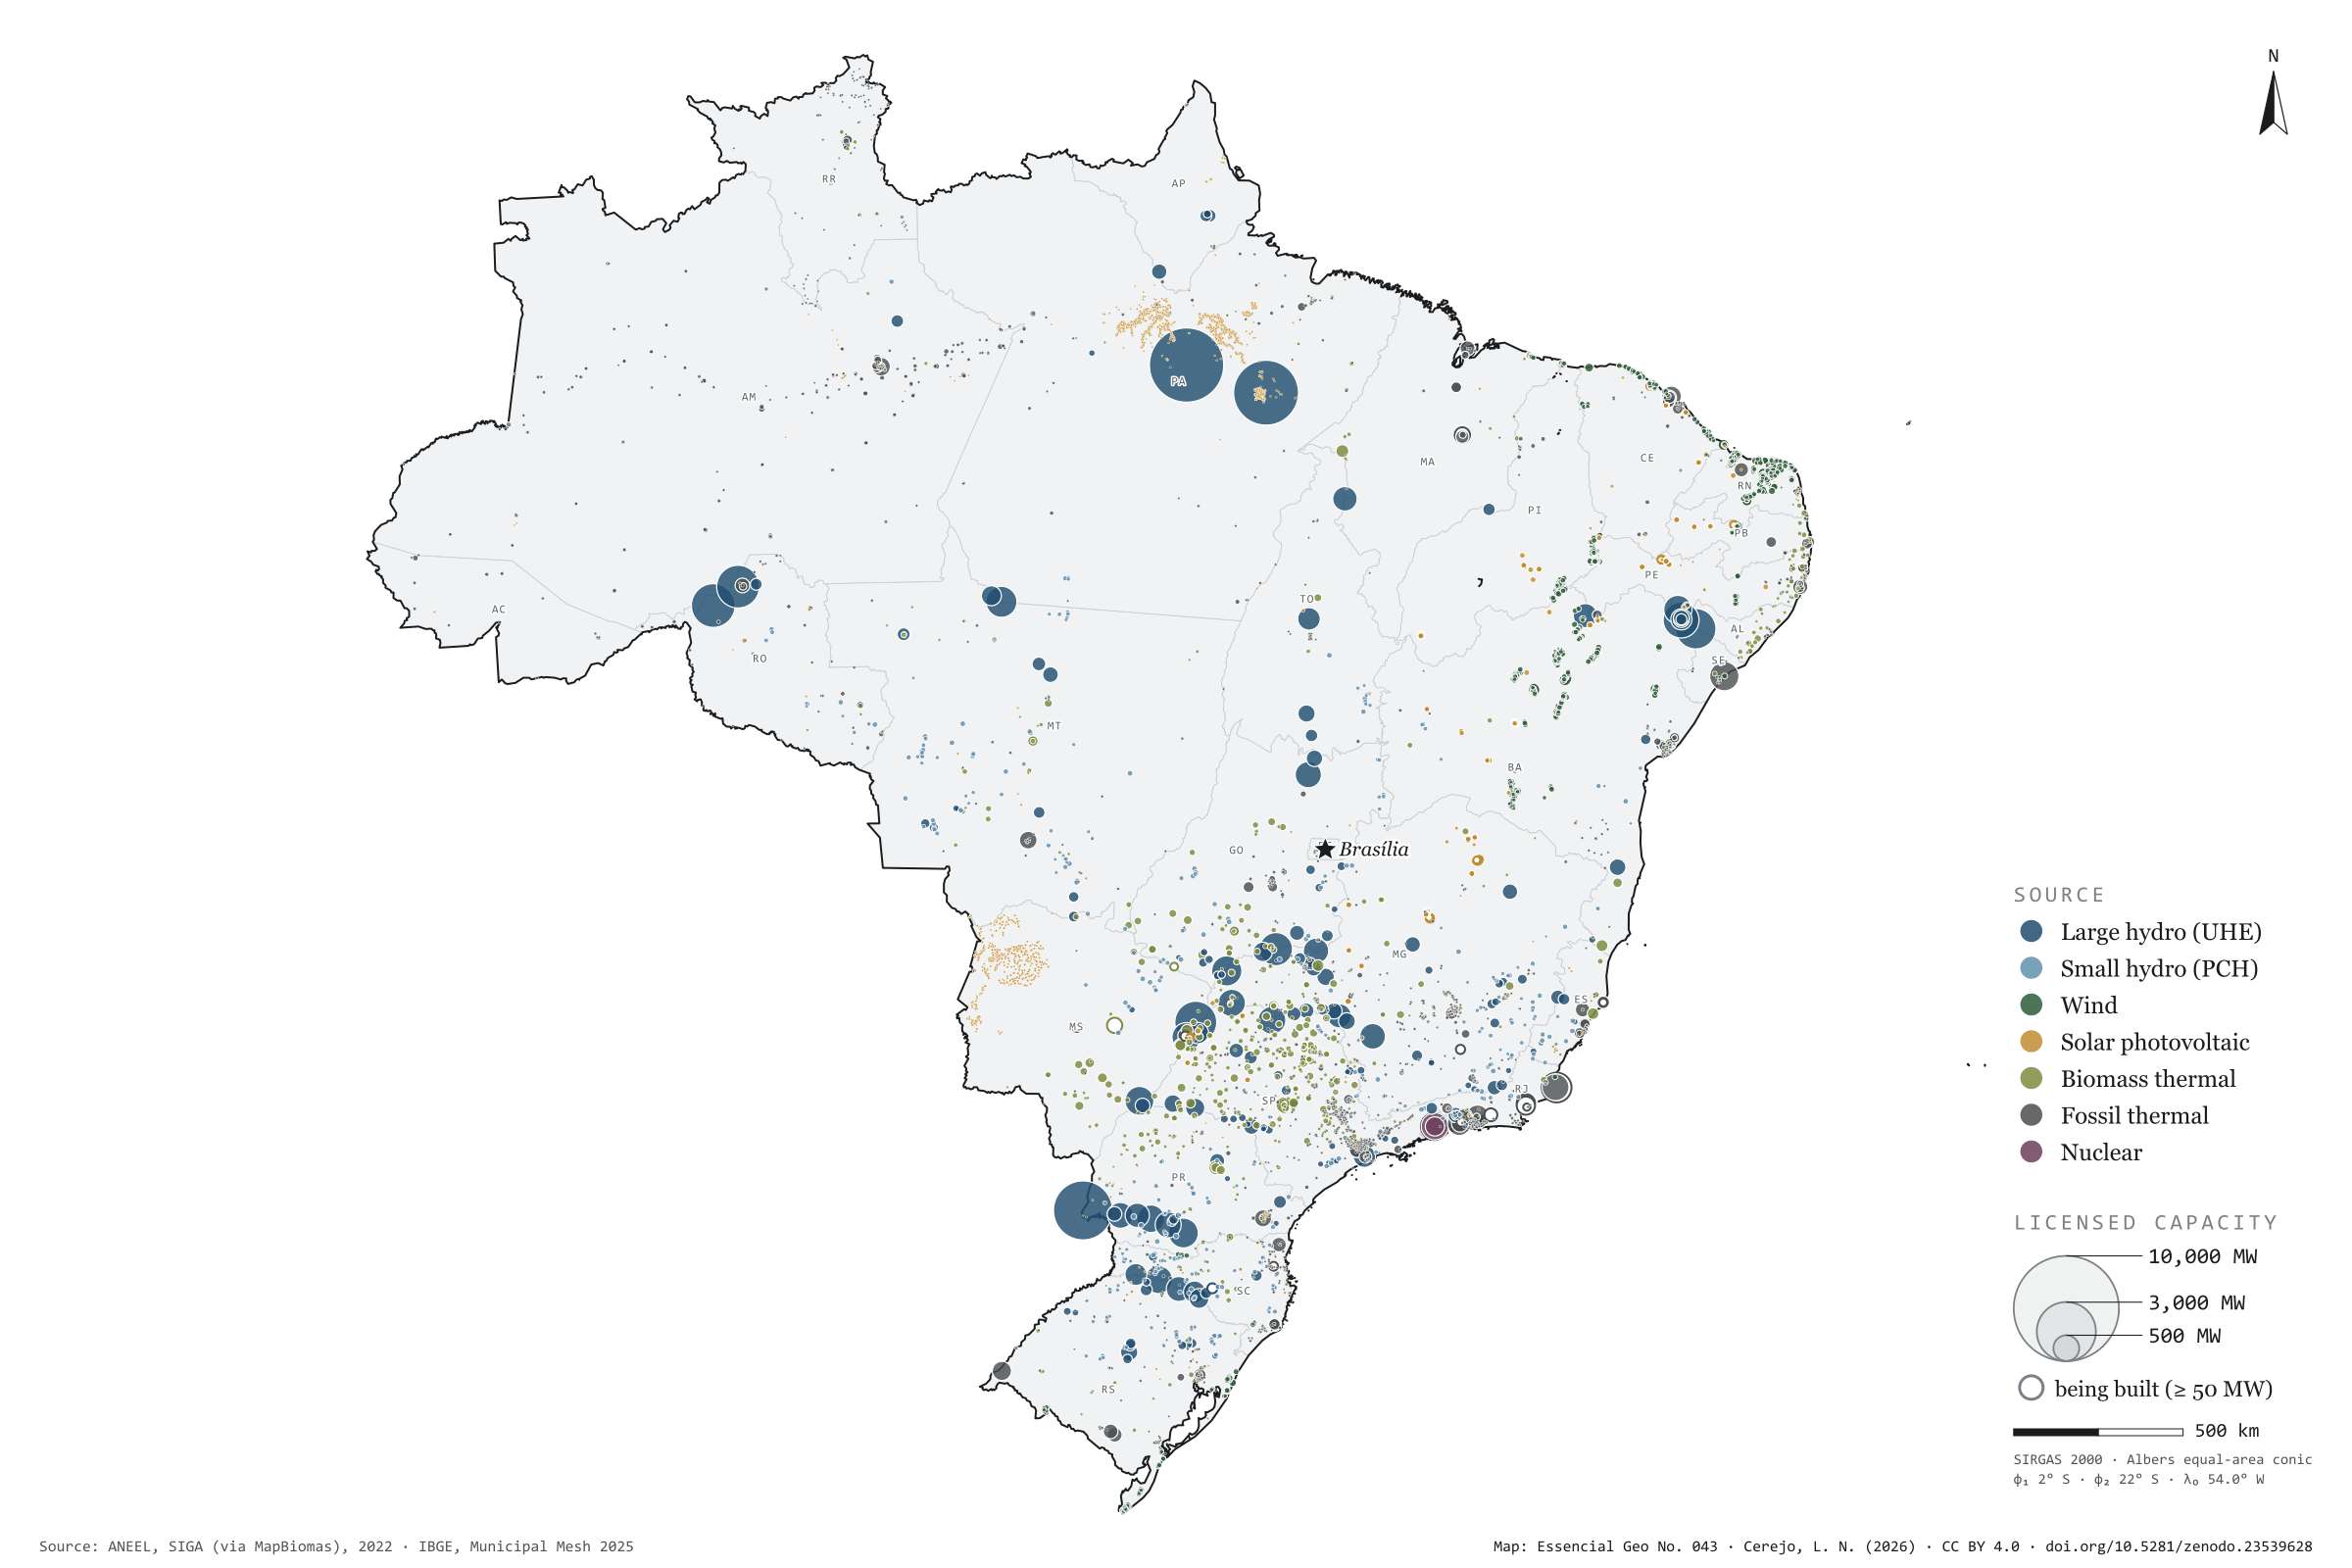
Belo Monte, on the Xingu, has 11,233 MW of licensed capacity: it is the largest of the 16,118 power plants registered with ANEEL, operating or under construction. Water still dominates: large and small hydro add up to 58.8% of the 184 GW in operation. In the smaller circles, the map tells other stories. The wind lines up 89% of the 993 wind farms in the North-East; sugarcane bagasse fires 427 of the 627 biomass power stations, 237 of them in São Paulo; and Angra 3 is still being built beside the other two. Of the 11,391 solar plants, 10,941 are under 5 kW: individual systems registered one by one by the distribution companies, nearly all in Pará and in the Pantanal of Mato Grosso do Sul. Second plate of the collection “Electricity in Brazil”.

Technical record · downloads · citation

At a glance

Operating mix, by licensed capacity (GW) (GW)
  • Hidrelétrica (UHE) 55.5%
  • Pequena central hidrelétrica 3.2%
  • Eólica 11.9%
  • Solar fotovoltaica 2.9%
  • Termelétrica a biomassa 9.1%
  • Termelétrica fóssil 16.3%
  • Termonuclear 1.1%
Belo Monte, the largest registered plant

11,233 MW

followed by Tucuruí (8,535 MW) and the Brazilian share of Itaipu (7,000 MW)

Layers

  • usinas point 16,118 power plants: source, fuel, phase, licensed and inspected capacity (kW), start of operations, owner and state
  • ufs polygon 27 states
  • limite_nacional polygon National boundary

Metadata

Extent
Brazil
CRS / Projection
SIRGAS 2000 (EPSG:4674)
EPSG:4674
Software
Python · GeoPandas · GDAL · QGIS · Node.js · d3-geo
Method
SIGA power plants operating and under construction, grouped into seven sources, with circles whose area is proportional to licensed capacity.
Version
v1.0.0
Licence
CC BY 4.0

Downloads

Figure to reuse

The map without a frame, with legend, scale, reference system and credit written on it: ready for papers, lectures and slides. In two versions: with the basemap (neighbours and sea) or only the mapped area, on white.

Point a camera at it to open this page.

How to cite

Cerejo, L. N. (2026). Usinas por fonte: água, vento, sol e fogo [Power plants by source: Water, wind, sun and fire] (Version 1.0.0) [Data set]. Zenodo. https://doi.org/10.5281/zenodo.23539628

How to read this plate area, projection, scale, legend and source · 3 terms
1 Area
Brazil The area the plate covers. Outside it, neighbours and sea are drawn in grey, just for orientation.
2 Coordinates and projection
SIRGAS 2000 (EPSG:4674) Drawn in Albers, which preserves areas, so the size of patches can be compared. The layers are in SIRGAS 2000; the drawing’s projection is written in the colophon at the foot of the panel.
3 Scale
Graphic scale bar in the panel The scale bar is true on the central meridian; away from it, measured distances vary a little.
4 Legend and layers
3 layers in the GeoPackage · point, polygon Read the legend before the map: it tells you whether a colour is a rate or a class, and whether a circle is a total.
5 Sources
ANEEL (2022); IBGE (2025); Natural Earth Every figure comes from a public source, with its year. The data sheet gives each one’s address.

Terms on this plate

Albers projection
An equal-area conic projection: it flattens the Earth onto paper without changing areas. A municipality twice as large takes up twice as much paper, which is why it is used to compare quantities across the whole of Brazil.
Bagasse
The fibre left after crushing. Burnt in the boilers, it makes the mill’s own steam and electricity; the surplus goes to the grid.
ANEEL
Brazil’s National Electricity Agency: it registers every power plant and distributed-generation system, with source, capacity and municipality.

Download

Layers, table and figures, under CC BY 4.0. Cite with the DOI.

Full record and citation

Method notes · No. 043

Brazil’s power plants by source

Português · English

Plate No. 043, the second of three in the collection Electricity in Brazil: after the wires, where power is made, and from what.

What the files contain

Layer (GPKG)GeometryContents
usinaspoint16,118 plants: nome, ceg (ANEEL code), fonte_mapa, fonte_rotulo, tipo, combustivel, fase, operacao, potencia_kw (licensed), potencia_fiscalizada_kw, inicio_operacao, proprietario, municipio_siga, uf (as declared in SIGA), uf_mapa (from the polygon the point falls in)
ufspolygon27 states, with their region
limite_nacionalpolygonoutline of the country

The GPKG is zipped and attached to the energia-eletrica-2026 release. Its QGIS styles match the plate: each source in its colour, circles growing with the square root of capacity, and the largest plants drawn underneath.

The CSV, also in the release, holds the table of the 16,118 plants in UTF-8, with longitude and latitude.

Method

  1. Plants registered in ANEEL’s SIGA, in the copy published by the MapBiomas infrastructure database: large and small hydro, wind, solar, thermal and nuclear, operating or under construction. The most recent start-ups in the database are from June 2022.
  2. Seven sources on the map: UHE, PCH, wind, solar photovoltaic, biomass thermal (bagasse, forestry residues, biogas, black liquor…), fossil thermal (diesel, natural gas, coal, fuel oil) and nuclear.
  3. Each circle’s area is proportional to licensed capacity; plants under construction with 50 MW or more are drawn hollow.
  4. The operating mix adds up the licensed capacity of each source’s operating plants: 184.3 GW in all, or 202.9 GW including those under construction.
  5. State totals use the state declared in SIGA, not the polygon the point falls in: border plants such as Ilha Solteira count in the state they are registered in.

Limitations

  • The database is a snapshot of 2022, and SIGA changes every month: solar and wind have grown a great deal since.
  • The 10,941 solar “plants” under 5 kW (0.26 to 4.32 kW, 11.7 MW in all) are individual systems: 9,227 from Pará’s distribution company, 1,621 from Mato Grosso do Sul’s and 78 from Amazonas’s. They swell the count of solar plants but weigh little in capacity.
  • Mini hydro stations (CGH), up to 5 MW, are not in the database.
  • Rooftop distributed generation (micro- and mini-generation) is a separate register and is left for the next plate.
  • 24 plants fall outside the state polygons, nearly all along the coast or on the water, such as the powerships in Sepetiba Bay; they stay in the GPKG with an empty uf_mapa.
  • Itaipu enters with its Brazilian share only, 7,000 MW.

View this map’s folder on GitHub

Technical record

Technical record · No. 043

Power plants by source

At a glance

Operating mix, by licensed capacity (GW) (GW)
  • Hidrelétrica (UHE) 55.5%
  • Pequena central hidrelétrica 3.2%
  • Eólica 11.9%
  • Solar fotovoltaica 2.9%
  • Termelétrica a biomassa 9.1%
  • Termelétrica fóssil 16.3%
  • Termonuclear 1.1%
Belo Monte, the largest registered plant

11,233 MW

followed by Tucuruí (8,535 MW) and the Brazilian share of Itaipu (7,000 MW)

Layers

  • usinas point 16,118 power plants: source, fuel, phase, licensed and inspected capacity (kW), start of operations, owner and state
  • ufs polygon 27 states
  • limite_nacional polygon National boundary

Metadata

Extent
Brazil
CRS / Projection
SIRGAS 2000 (EPSG:4674)
EPSG:4674
Software
Python · GeoPandas · GDAL · QGIS · Node.js · d3-geo
Method
SIGA power plants operating and under construction, grouped into seven sources, with circles whose area is proportional to licensed capacity.
Version
v1.0.0
Licence
CC BY 4.0

Downloads

Figure to reuse

The map without a frame, with legend, scale, reference system and credit written on it: ready for papers, lectures and slides. In two versions: with the basemap (neighbours and sea) or only the mapped area, on white.

Point a camera at it to open this page.

How to cite

Cerejo, L. N. (2026). Usinas por fonte: água, vento, sol e fogo [Power plants by source: Water, wind, sun and fire] (Version 1.0.0) [Data set]. Zenodo. https://doi.org/10.5281/zenodo.23539628

100%