Skip to content
Essencial

No. 052 Census · income Sanitation and biomethane 2/4

Where the sewage goes

Mains in town, pits in the country, rivers at the edge

Record, downloads and citation
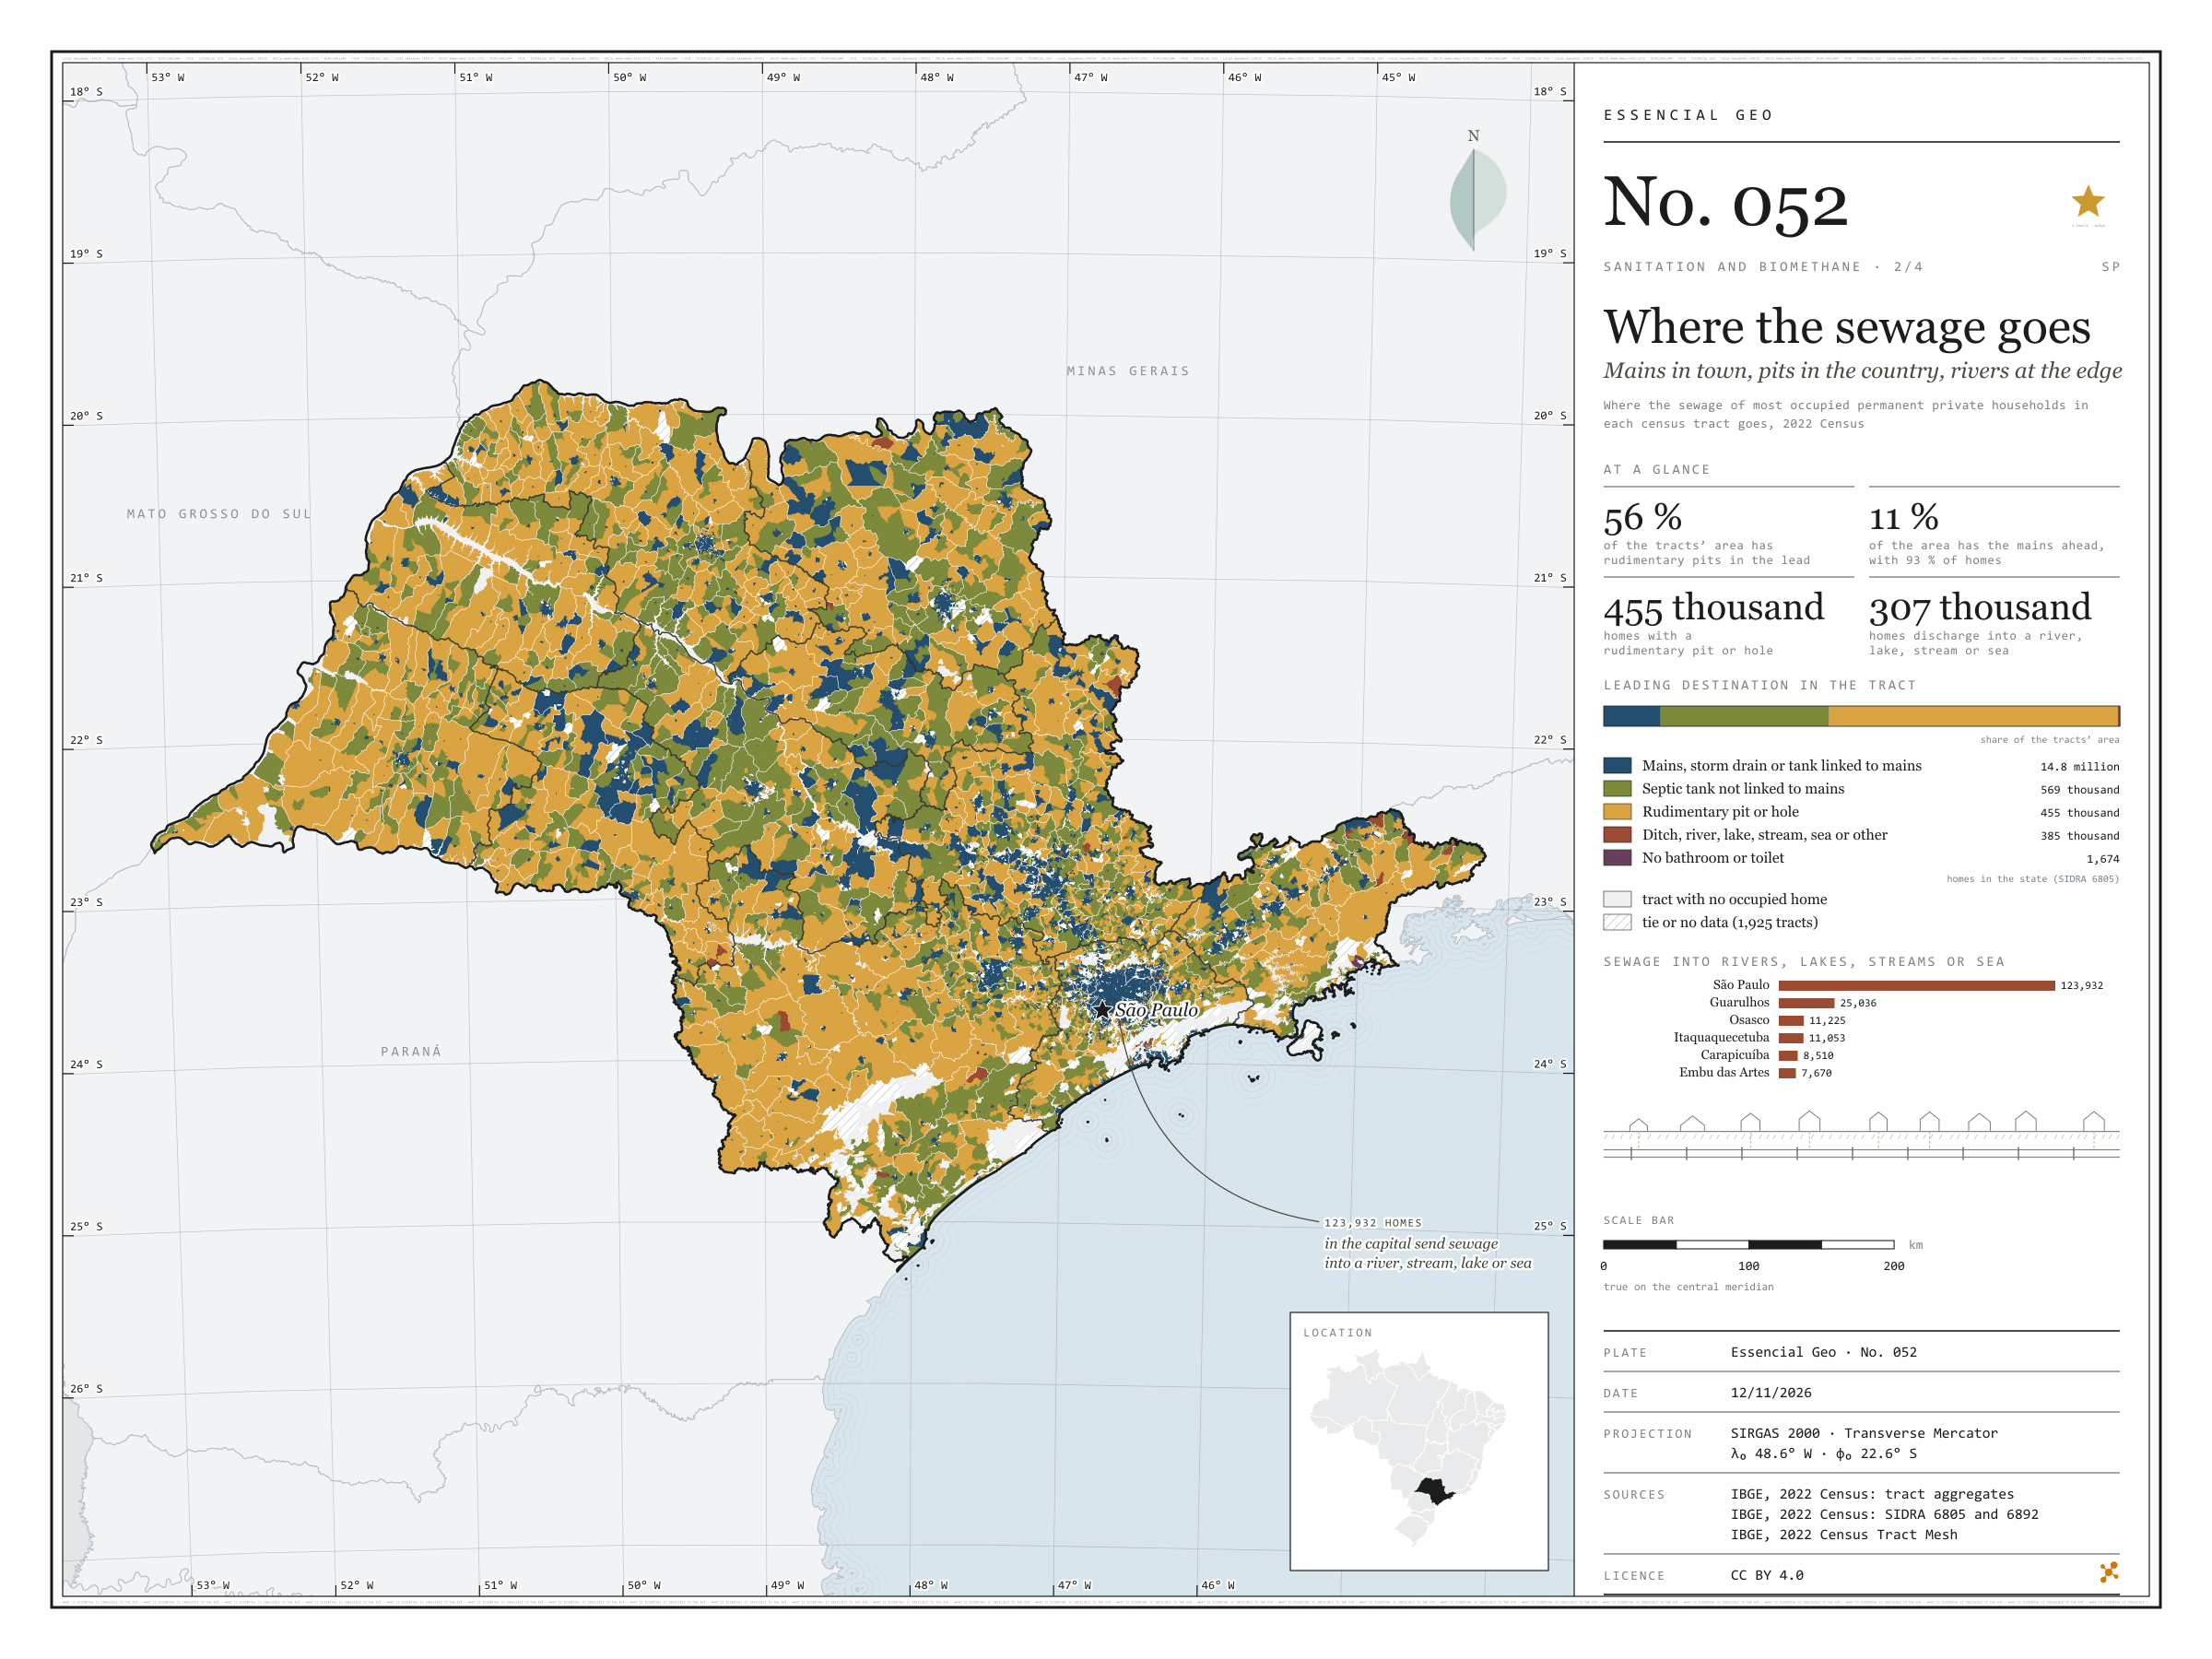
Fig. 052 São Paulo State (SP) EPSG:4674 Source: IBGE

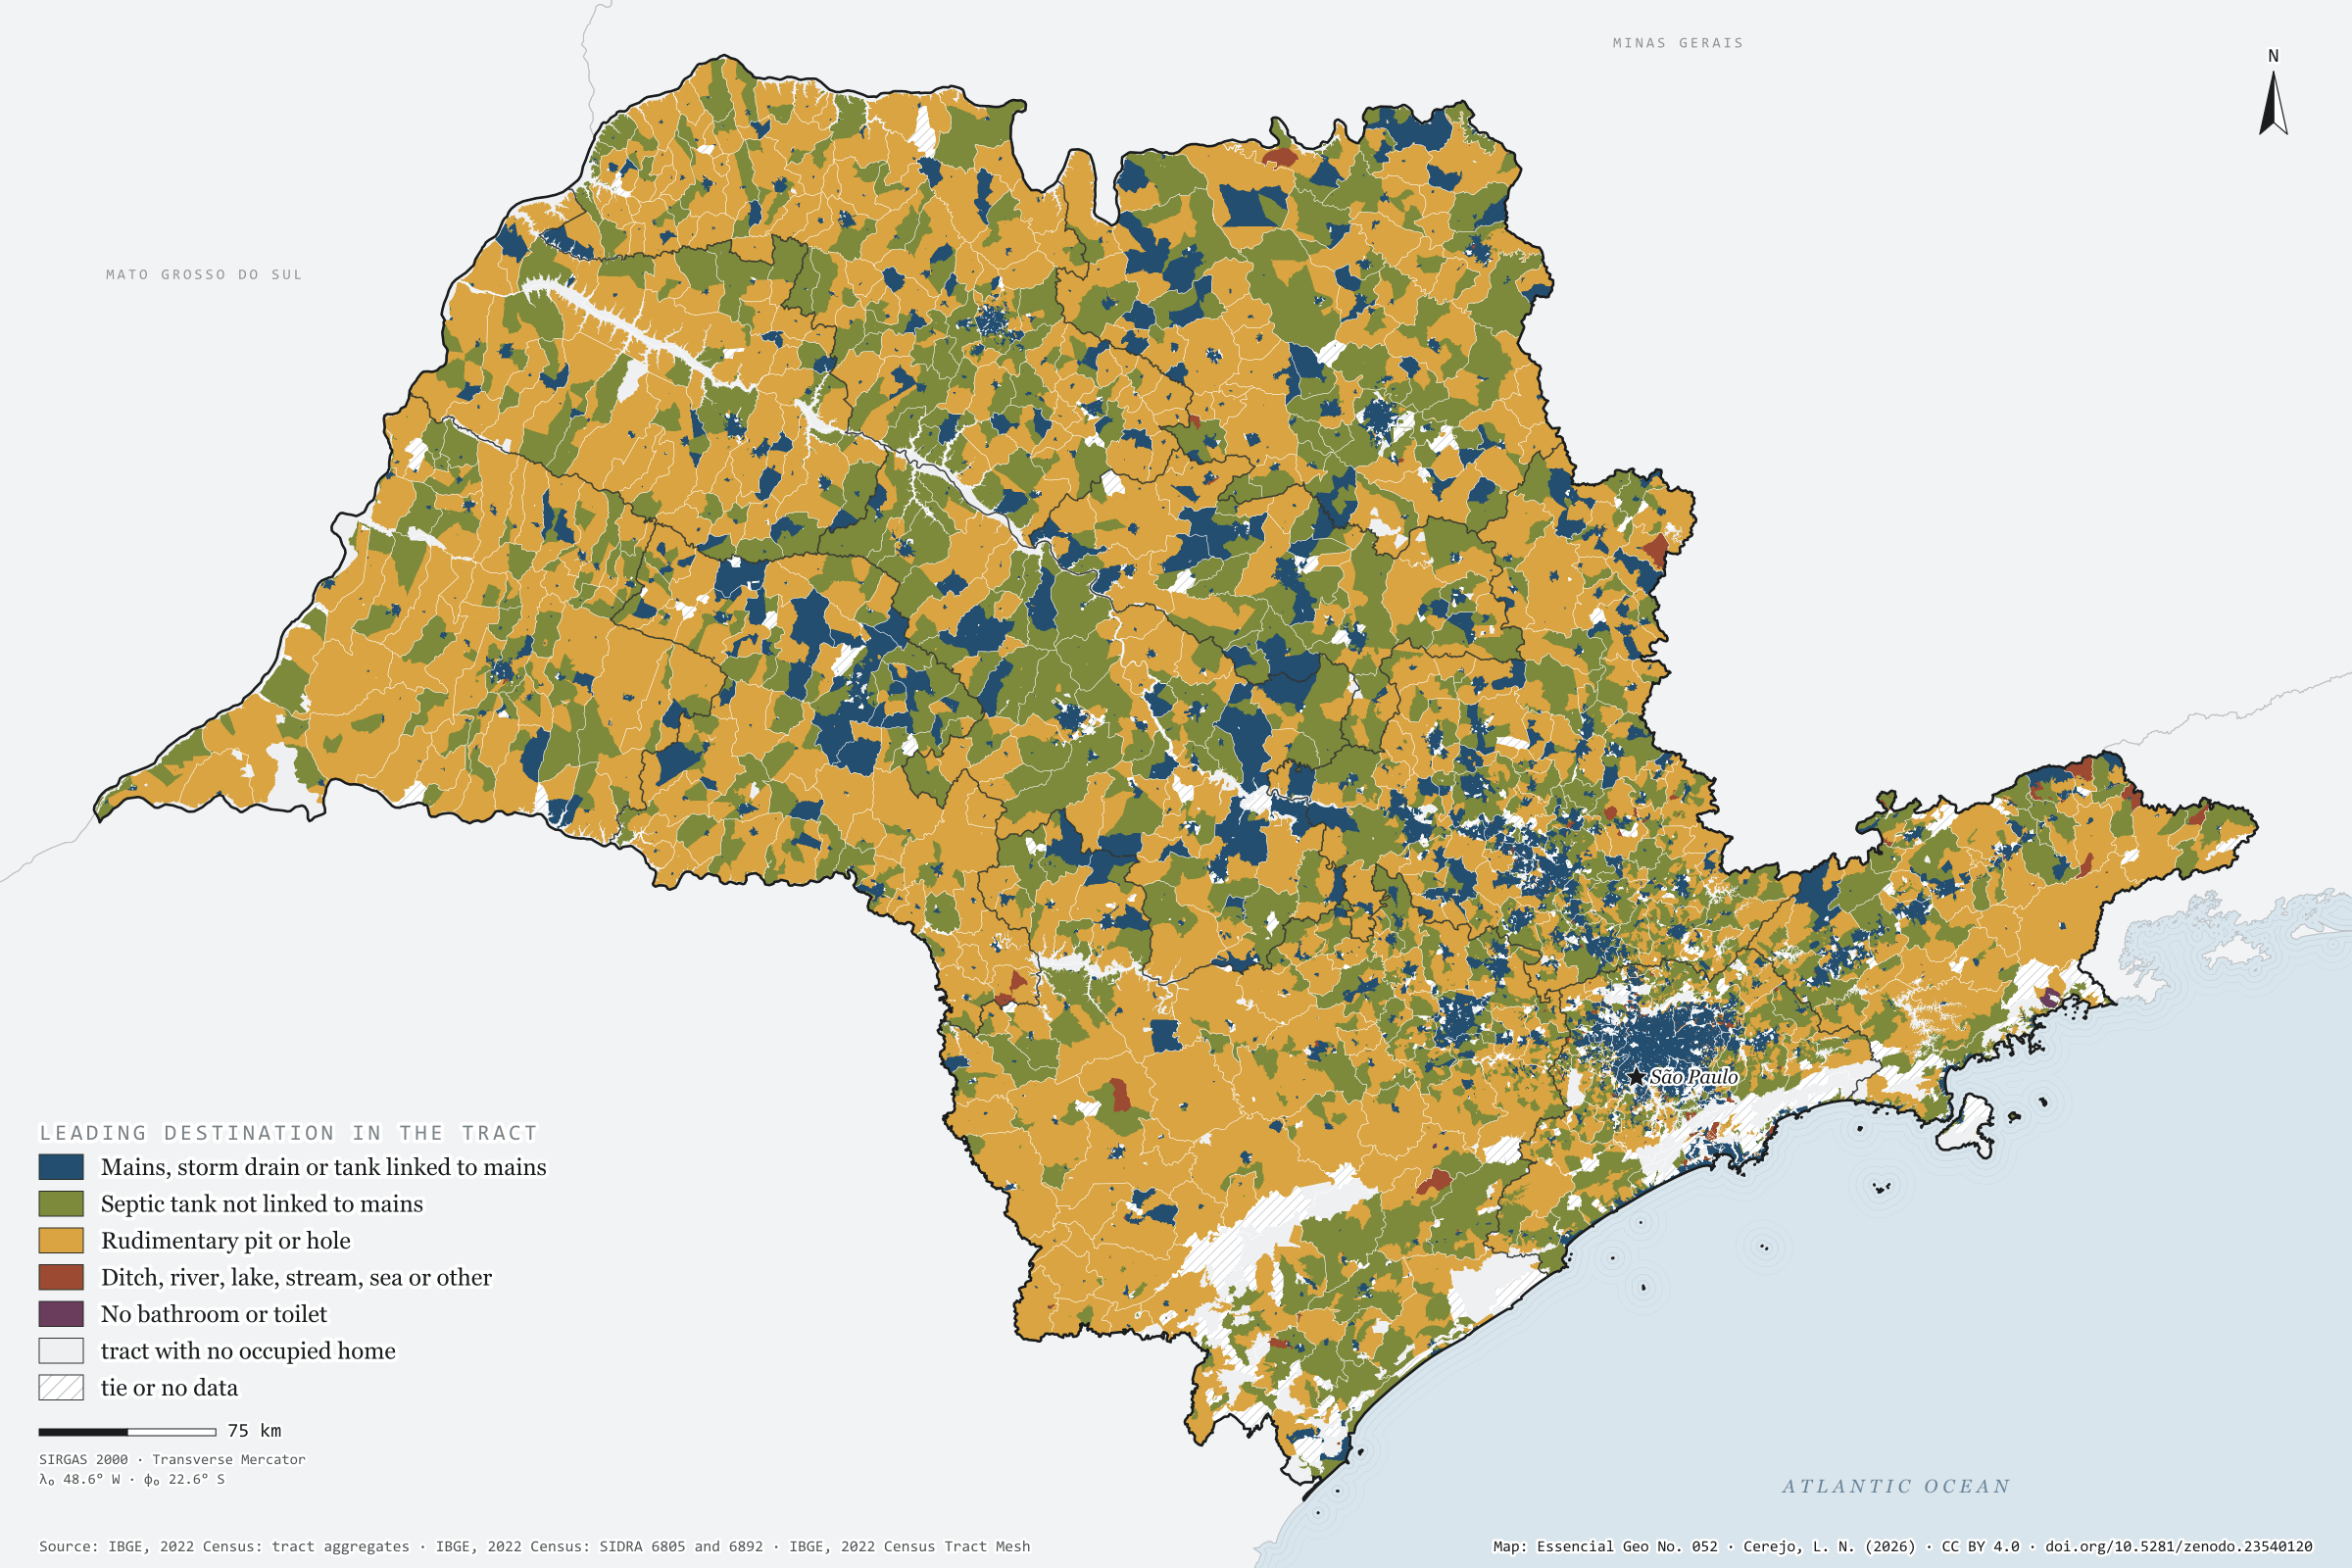
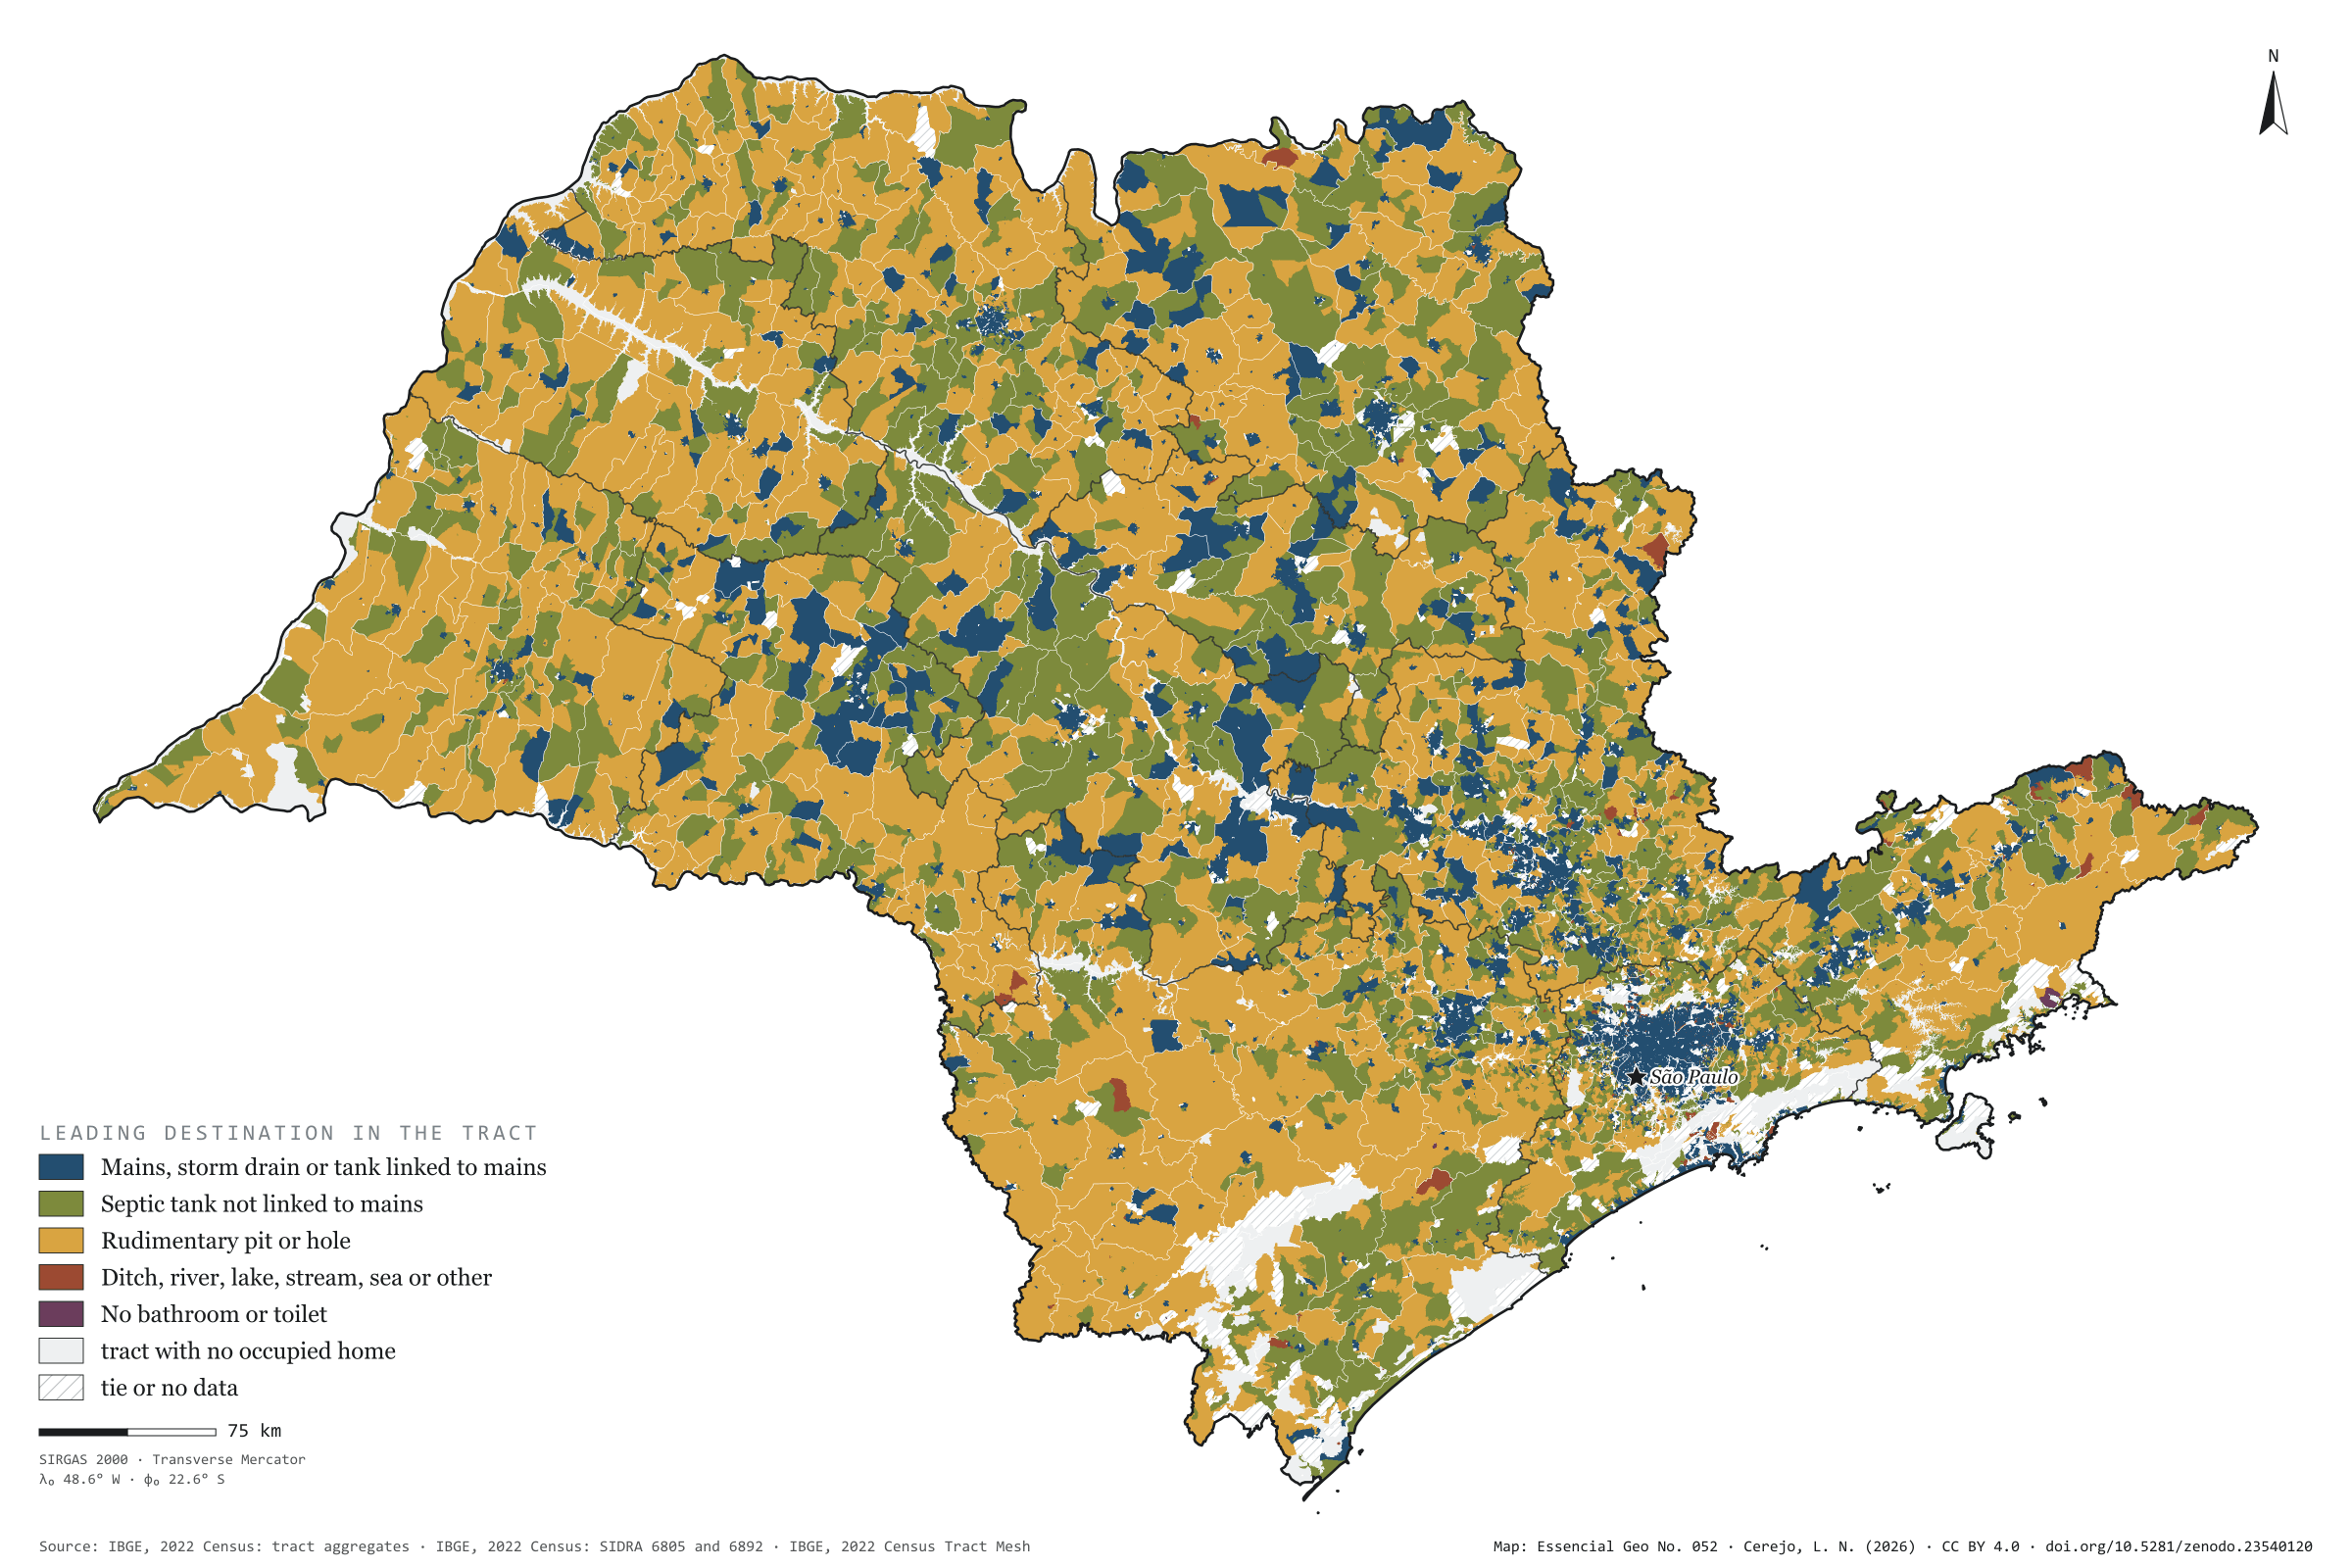
Off the mains, São Paulo’s sewage goes three ways. In 2022, 569,000 households used a septic tank, 455,000 a rudimentary pit or hole, and 385,000 discharged into a ditch, river, lake, stream, the sea or elsewhere. The map colours each census tract by where most of its households send their sewage. The mains lead in only 11% of the area, but 93% of households live there; rudimentary pits lead in 56% of the area and septic tanks in 33%, in a mosaic that covers the interior. Sewage discharged into rivers, lakes, streams or the sea is urban: of the 307,000 households doing so, 124,000 are in the capital and three quarters of the rest in the São Paulo intermediate region. Second plate of the collection “Sanitation and biomethane”.

Technical record · downloads · citation

At a glance

Households by sewage destination in the state (households)
  • Mains, storm drain or linked tank 91.3%
  • Septic tank not linked 3.5%
  • Rudimentary pit or hole 2.8%
  • Ditch, river, lake, stream, sea or other 2.4%
  • No bathroom or toilet 0%
Tract area where rudimentary pits lead

56 %

129,000 km² of 231,000 km² of tracts with a defined leader

Households in the capital discharging sewage into rivers, lakes, streams or the sea

123,932 households

40% of the state’s 306,691

Layers

  • setores polygon 103,319 census tracts: households by sewage destination and leading destination (same GPKG as plate 051)
  • regioes_intermediarias polygon 11 intermediate geographic regions
  • limite_estadual polygon State boundary

Metadata

Extent
São Paulo State (SP)
CRS / Projection
SIRGAS 2000 (EPSG:4674)
EPSG:4674
Software
Node.js · d3-geo · QGIS
Method
Where the sewage of most occupied permanent private households in each census tract goes, in five groups; a group wins only when its minimum exceeds every other group’s maximum, counting withheld values as 1 or 2.
Version
v1.0.0
Licence
CC BY 4.0

Downloads

Figure to reuse

The map without a frame, with legend, scale, reference system and credit written on it: ready for papers, lectures and slides. In two versions: with the basemap (neighbours and sea) or only the mapped area, on white.

Point a camera at it to open this page.

How to cite

Cerejo, L. N. (2026). Para onde vai o esgoto: rede na cidade, fossa no campo, rio na beira [Where the sewage goes: Mains in town, pits in the country, rivers at the edge] (Version 1.0.0) [Data set]. Zenodo. https://doi.org/10.5281/zenodo.23540120

How to read this plate area, projection, scale, legend and source · 2 terms
1 Area
São Paulo State (SP) The area the plate covers. Outside it, neighbours and sea are drawn in grey, just for orientation.
2 Coordinates and projection
SIRGAS 2000 (EPSG:4674) The layers are in SIRGAS 2000; the drawing’s projection is written in the colophon at the foot of the panel.
3 Scale
Graphic scale bar in the panel The scale bar is true on the central meridian; away from it, measured distances vary a little.
4 Legend and layers
3 layers in the GeoPackage · polygon Read the legend before the map: it tells you whether a colour is a rate or a class, and whether a circle is a total.
5 Sources
IBGE (2022) Every figure comes from a public source, with its year. The data sheet gives each one’s address.

Terms on this plate

Census tract
The smallest collection area of the IBGE Census, a few hundred households each. It is the finest grain at which income, sanitation and housing can be seen without identifying anyone.
Biomethane
Biogas upgraded, with most of the CO₂ removed, to ANP’s specification, at which point it replaces natural gas in the pipeline, in industry and in the lorry’s tank.

Download

Layers, table and figures, under CC BY 4.0. Cite with the DOI.

Full record and citation

Method notes · No. 052

Where the sewage of São Paulo’s census tracts goes

Português · English

Plate No. 052, the second of four in the collection Sanitation and biomethane: what happens to sewage that does not reach the mains.

What the files contain

The GPKG is the same as plate 051: the setores layer holds the number of households for each destination and the destino field (rede mains, septica septic tank, rudimentar pit, aberto open discharge, sem no toilet, or empty). This plate’s QGIS style is destino_do_esgoto.

Method

  1. 2022 Census tract aggregates: occupied permanent private households by where the sewage from the bathroom or toilet goes.
  2. Five groups: mains (mains or storm drain and tank linked to the mains); septic tank not linked; rudimentary pit or hole; open discharge (ditch; river, lake, stream or sea; other); and no bathroom or toilet.
  3. The leading destination is the group with the most households. Withheld values (X, which in São Paulo’s data hide a 1 or a 2) enter as a range: a group wins only when its minimum exceeds every other group’s maximum. The 1,925 tied or undecided tracts are hatched.
  4. Panel strip: the area of the tracts in each leading destination (231,000 km² with a defined leader). Totals by destination: SIDRA table 6805.

Limitations

  • Leading only means largest: a blue tract may have a third of its households on tanks.
  • The difference between septic and rudimentary is as declared to the enumerator.
  • A large rural tract weighs a lot on the map and little in the numbers.

View this map’s folder on GitHub

Technical record

Technical record · No. 052

Where the sewage goes

At a glance

Households by sewage destination in the state (households)
  • Mains, storm drain or linked tank 91.3%
  • Septic tank not linked 3.5%
  • Rudimentary pit or hole 2.8%
  • Ditch, river, lake, stream, sea or other 2.4%
  • No bathroom or toilet 0%
Tract area where rudimentary pits lead

56 %

129,000 km² of 231,000 km² of tracts with a defined leader

Households in the capital discharging sewage into rivers, lakes, streams or the sea

123,932 households

40% of the state’s 306,691

Layers

  • setores polygon 103,319 census tracts: households by sewage destination and leading destination (same GPKG as plate 051)
  • regioes_intermediarias polygon 11 intermediate geographic regions
  • limite_estadual polygon State boundary

Metadata

Extent
São Paulo State (SP)
CRS / Projection
SIRGAS 2000 (EPSG:4674)
EPSG:4674
Software
Node.js · d3-geo · QGIS
Method
Where the sewage of most occupied permanent private households in each census tract goes, in five groups; a group wins only when its minimum exceeds every other group’s maximum, counting withheld values as 1 or 2.
Version
v1.0.0
Licence
CC BY 4.0

Downloads

Figure to reuse

The map without a frame, with legend, scale, reference system and credit written on it: ready for papers, lectures and slides. In two versions: with the basemap (neighbours and sea) or only the mapped area, on white.

Point a camera at it to open this page.

How to cite

Cerejo, L. N. (2026). Para onde vai o esgoto: rede na cidade, fossa no campo, rio na beira [Where the sewage goes: Mains in town, pits in the country, rivers at the edge] (Version 1.0.0) [Data set]. Zenodo. https://doi.org/10.5281/zenodo.23540120

100%