The Serra do Mar
Eight hundred metres between port and plateau
Record, downloads and citationProfile A–B leaves the beach at Santos and runs 15 km across the lowland, between the mangroves and the port; apart from a 109 m hill right at the start, it stays a few metres above sea level. Then the Serra do Mar rises over Cubatão: 769 m of climb in 5 km, and at the top begins the plateau, which rolls on at around 760 m to São Bernardo do Campo and São Paulo. The whole slope, from 20 to 700 m, takes up only 596 km² in the frame’s elevation bands, 14% of the land; 72.5% of the ground lies above 700 m. The Anchieta and Imigrantes motorways and the railway climb this wall, and the Billings reservoir’s water is pumped down it to Cubatão. The highest point in the frame, 1,185 m, is in Mogi das Cruzes. Second plate of the collection “The relief of São Paulo”.
Technical record · downloads · citation
At a glance
769 m
73 %
Layers
- relevo raster GeoTIFF of elevation in metres (90 m pixels) clipped to the frame, with the plate’s hypsometric ramp in a .qml style
- faixas_altitude polygon 10 elevation bands, finer near the sea, with the area of each
- perfil line The A–B profile line, 35.7 km
- ponto_mais_alto point Highest point in the frame, 1,185 m, in Mogi das Cruzes
- municipios polygon The 25 São Paulo municipalities in the frame
Metadata
- Sources
- Copernicus DEM GLO-90 (ESA, European Union), digital surface model, 90 m pixels
WWF / HydroSHEDS — HydroRIVERS v1.0, South America (Lehner and Grill, 2013)
IBGE — Municipal Mesh 2025 (2025) - Extent
- Santos lowland, Serra do Mar and São Paulo plateau, between Mongaguá, Bertioga and São Paulo (SP)
- CRS / Projection
- SIRGAS 2000 (EPSG:4674)
EPSG:4674 - Software
- Python · rasterio · GeoPandas · SciPy · GDAL · QGIS · Node.js · d3-geo
- Method
- Copernicus DEM GLO-90 tiles mosaicked, lit from the north-west with relief exaggerated 1.8 times and coloured by elevation band; profile A–B sampled at 600 points.
- Version
- v1.0.0
- Licence
- CC BY 4.0
Downloads
- GPKG Elevation bands, profile, highest point and municipalities, SIRGAS 2000, with QGIS styles (.gpkg) 0.9 MB
- TIF Elevation in the frame (GeoTIFF, 90 m) with a .qml style (.tif) 0.6 MB
- CSV Profile A–B: 600 points with distance, coordinates and elevation (.csv) 18 kB
- SVG Vector plate, for printing (.svg) 2.7 MB
- PNG Plate (PNG, 2400 px) (.png) 1.5 MB

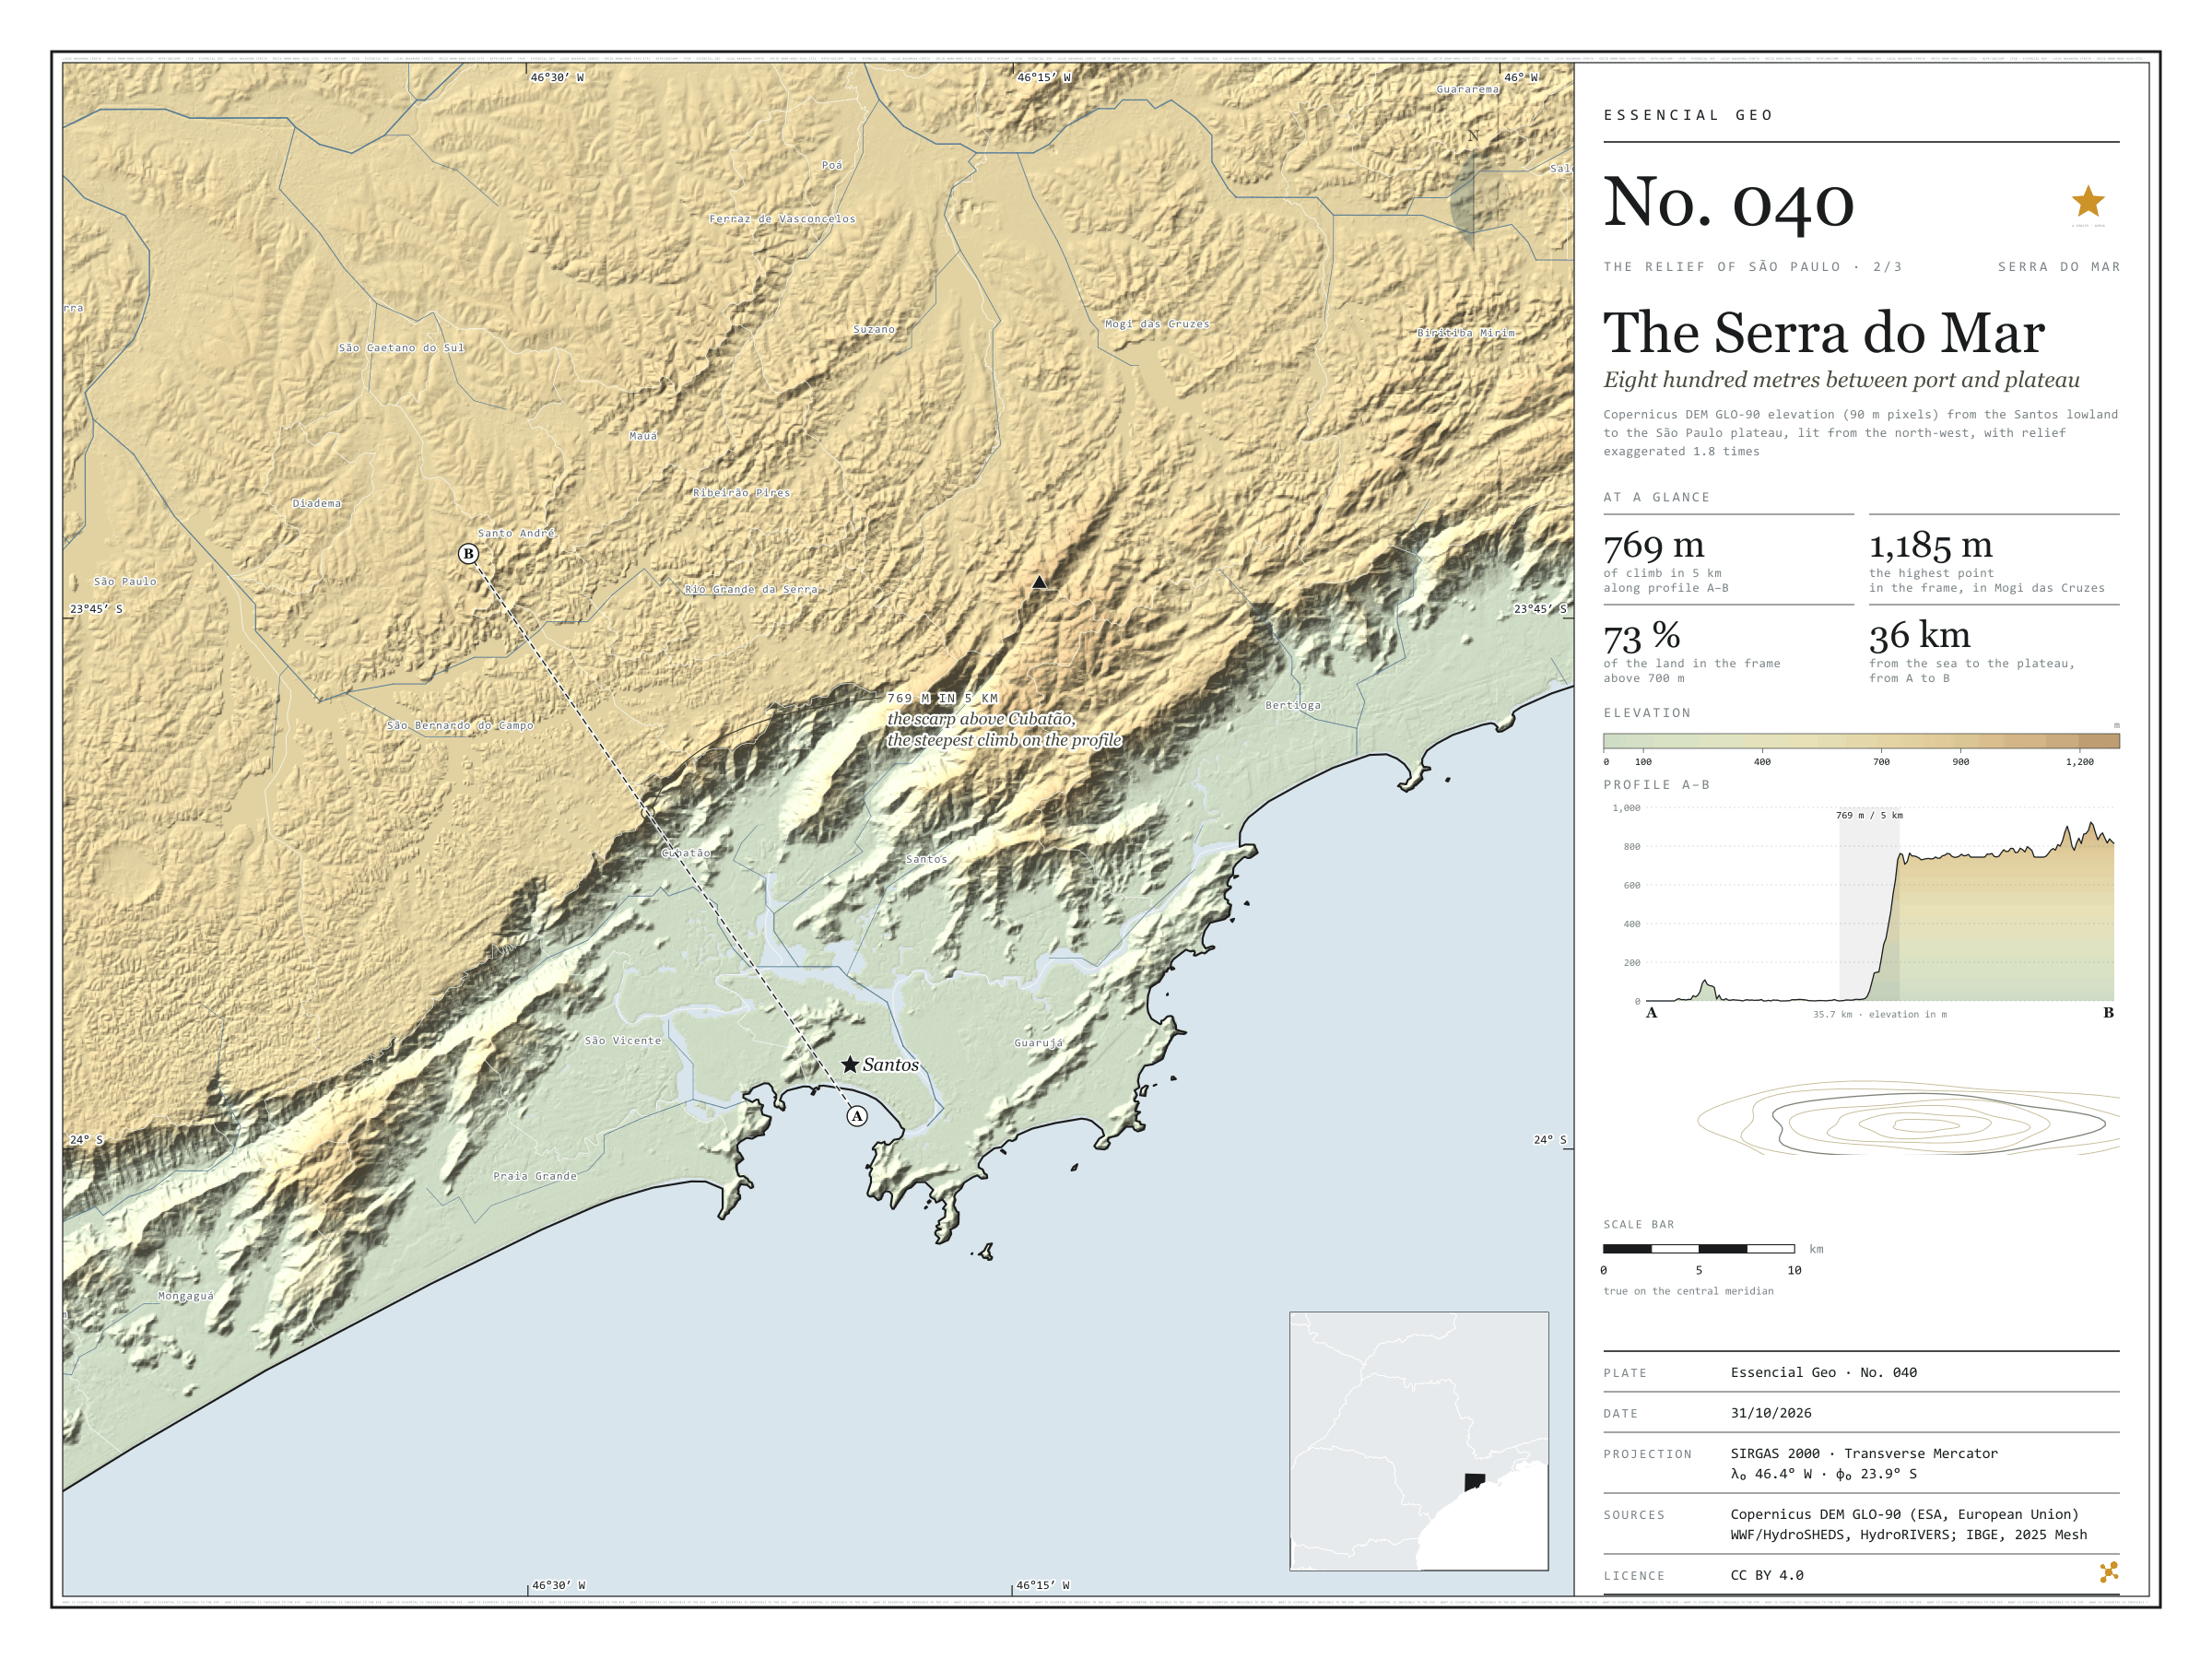
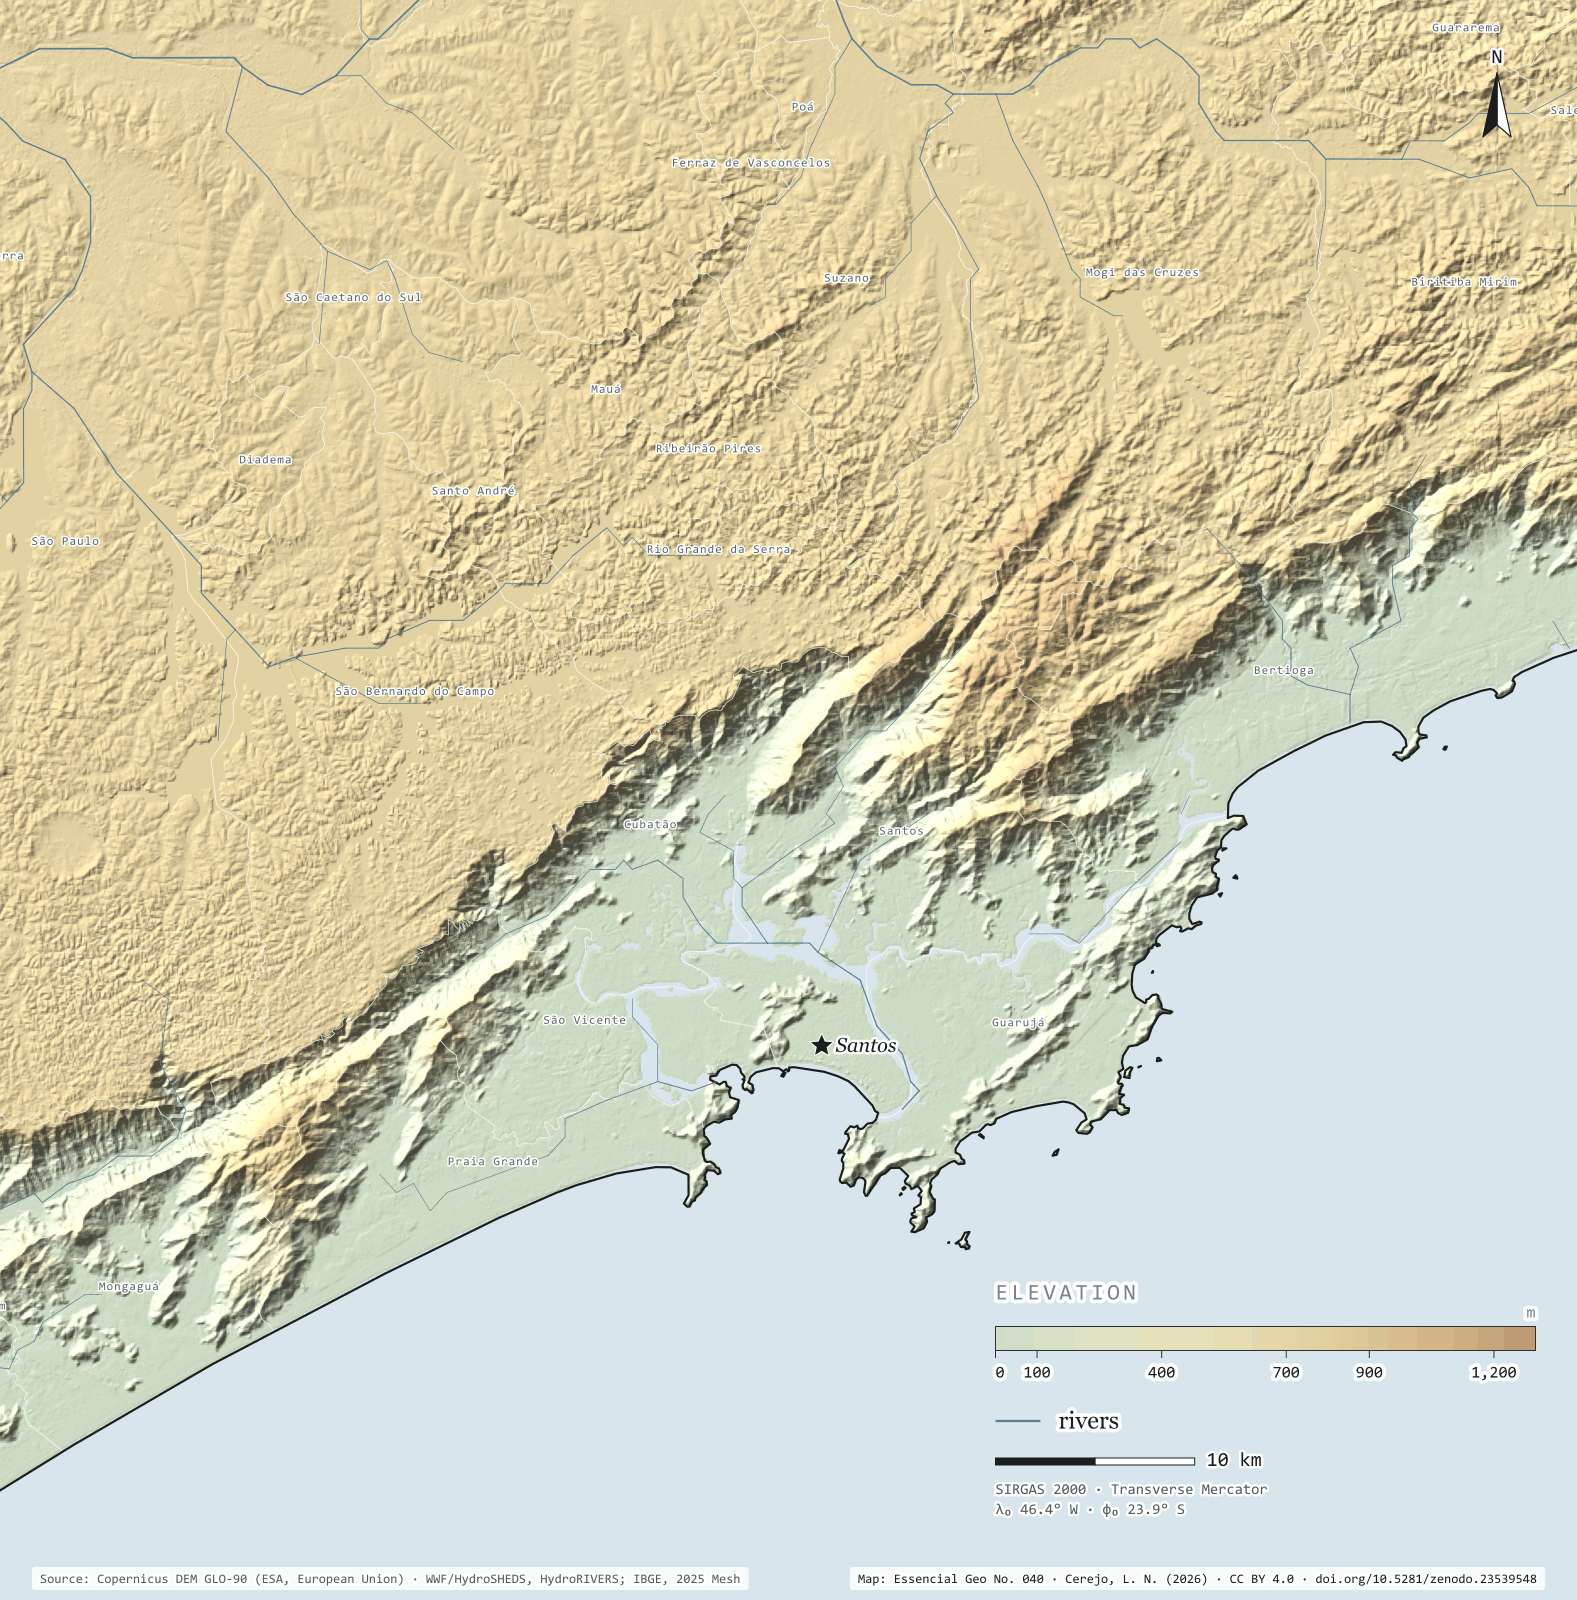
Figure to reuse
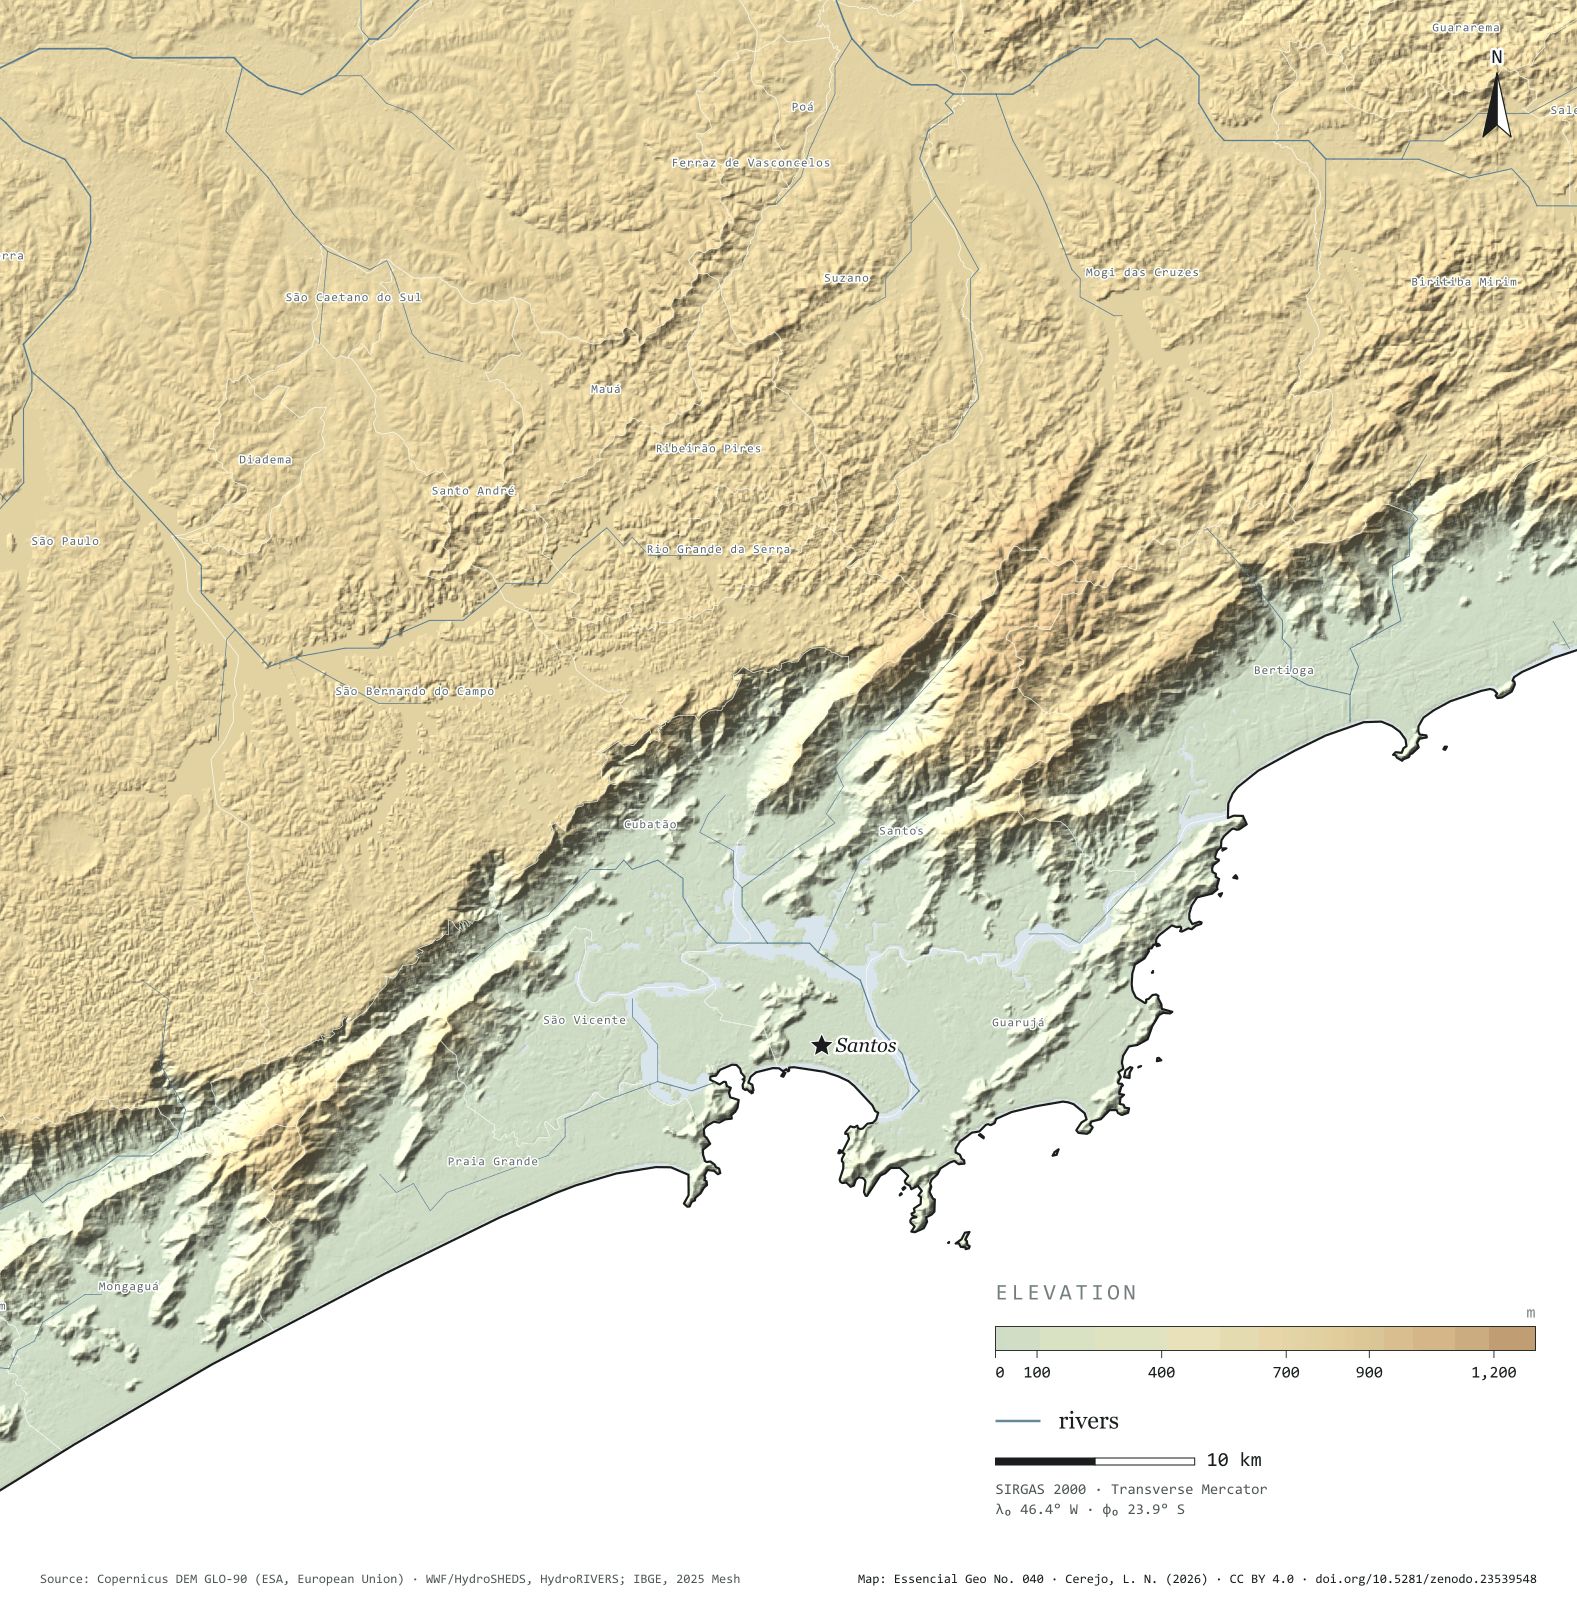
The map without a frame, with legend, scale, reference system and credit written on it: ready for papers, lectures and slides. In two versions: with the basemap (neighbours and sea) or only the mapped area, on white.
With basemap (PNG) Without basemap (PNG) QR code (SVG)
Point a camera at it to open this page.
How to cite
CEREJO, Lucas Nakamura. Serra do Mar: oitocentos metros entre o porto e o planalto. Versão 1.0.0. [S. l.]: Zenodo, 2026. Conjunto de dados. DOI: 10.5281/zenodo.23539548. Disponível em: https://doi.org/10.5281/zenodo.23539548. Acesso em: 10 nov. 2026.
Cerejo, L. N. (2026). Serra do Mar: oitocentos metros entre o porto e o planalto [The Serra do Mar: Eight hundred metres between port and plateau] (Version 1.0.0) [Data set]. Zenodo. https://doi.org/10.5281/zenodo.23539548
@dataset{cerejo2026_serra_do_mar,
  author    = {Cerejo, Lucas Nakamura},
  title     = {Serra do Mar: Oitocentos metros entre o porto e o planalto},
  year      = {2026},
  publisher = {Zenodo},
  version   = {1.0.0},
  doi       = {10.5281/zenodo.23539548},
  url       = {https://doi.org/10.5281/zenodo.23539548},
  language  = {portuguese},
  note      = {English title: The Serra do Mar: Eight hundred metres between port and plateau. Licence CC BY 4.0}
}