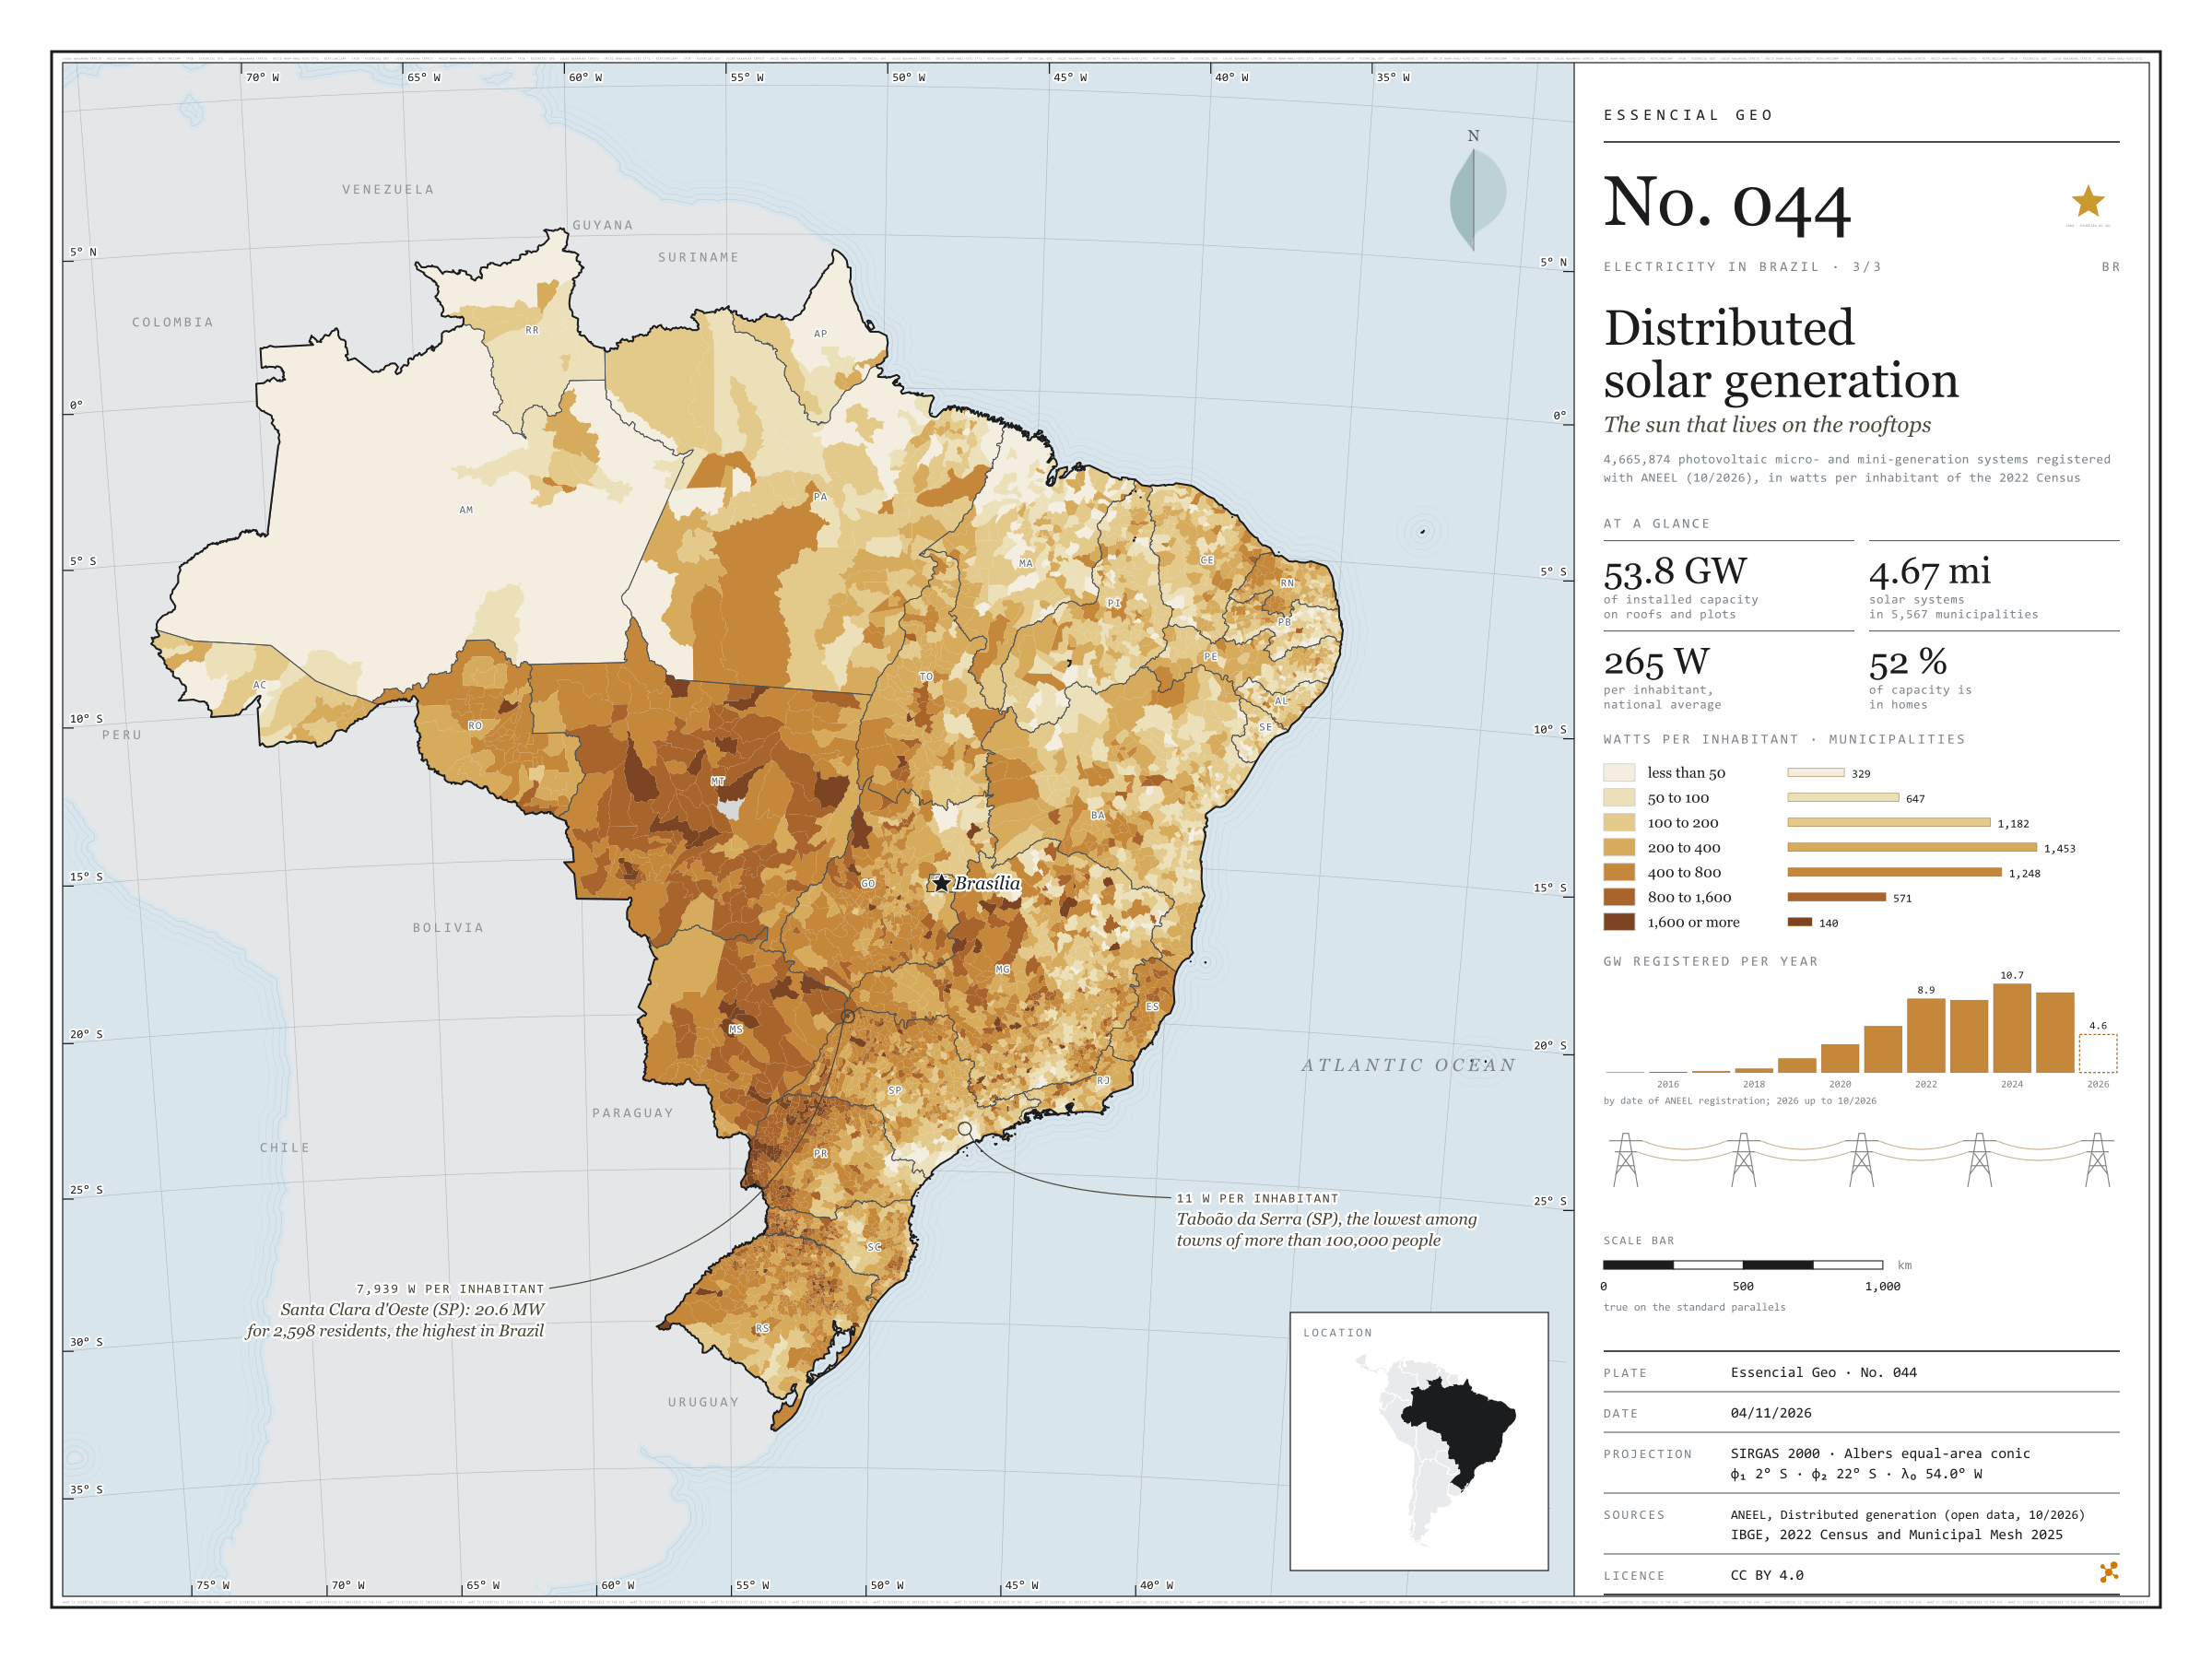
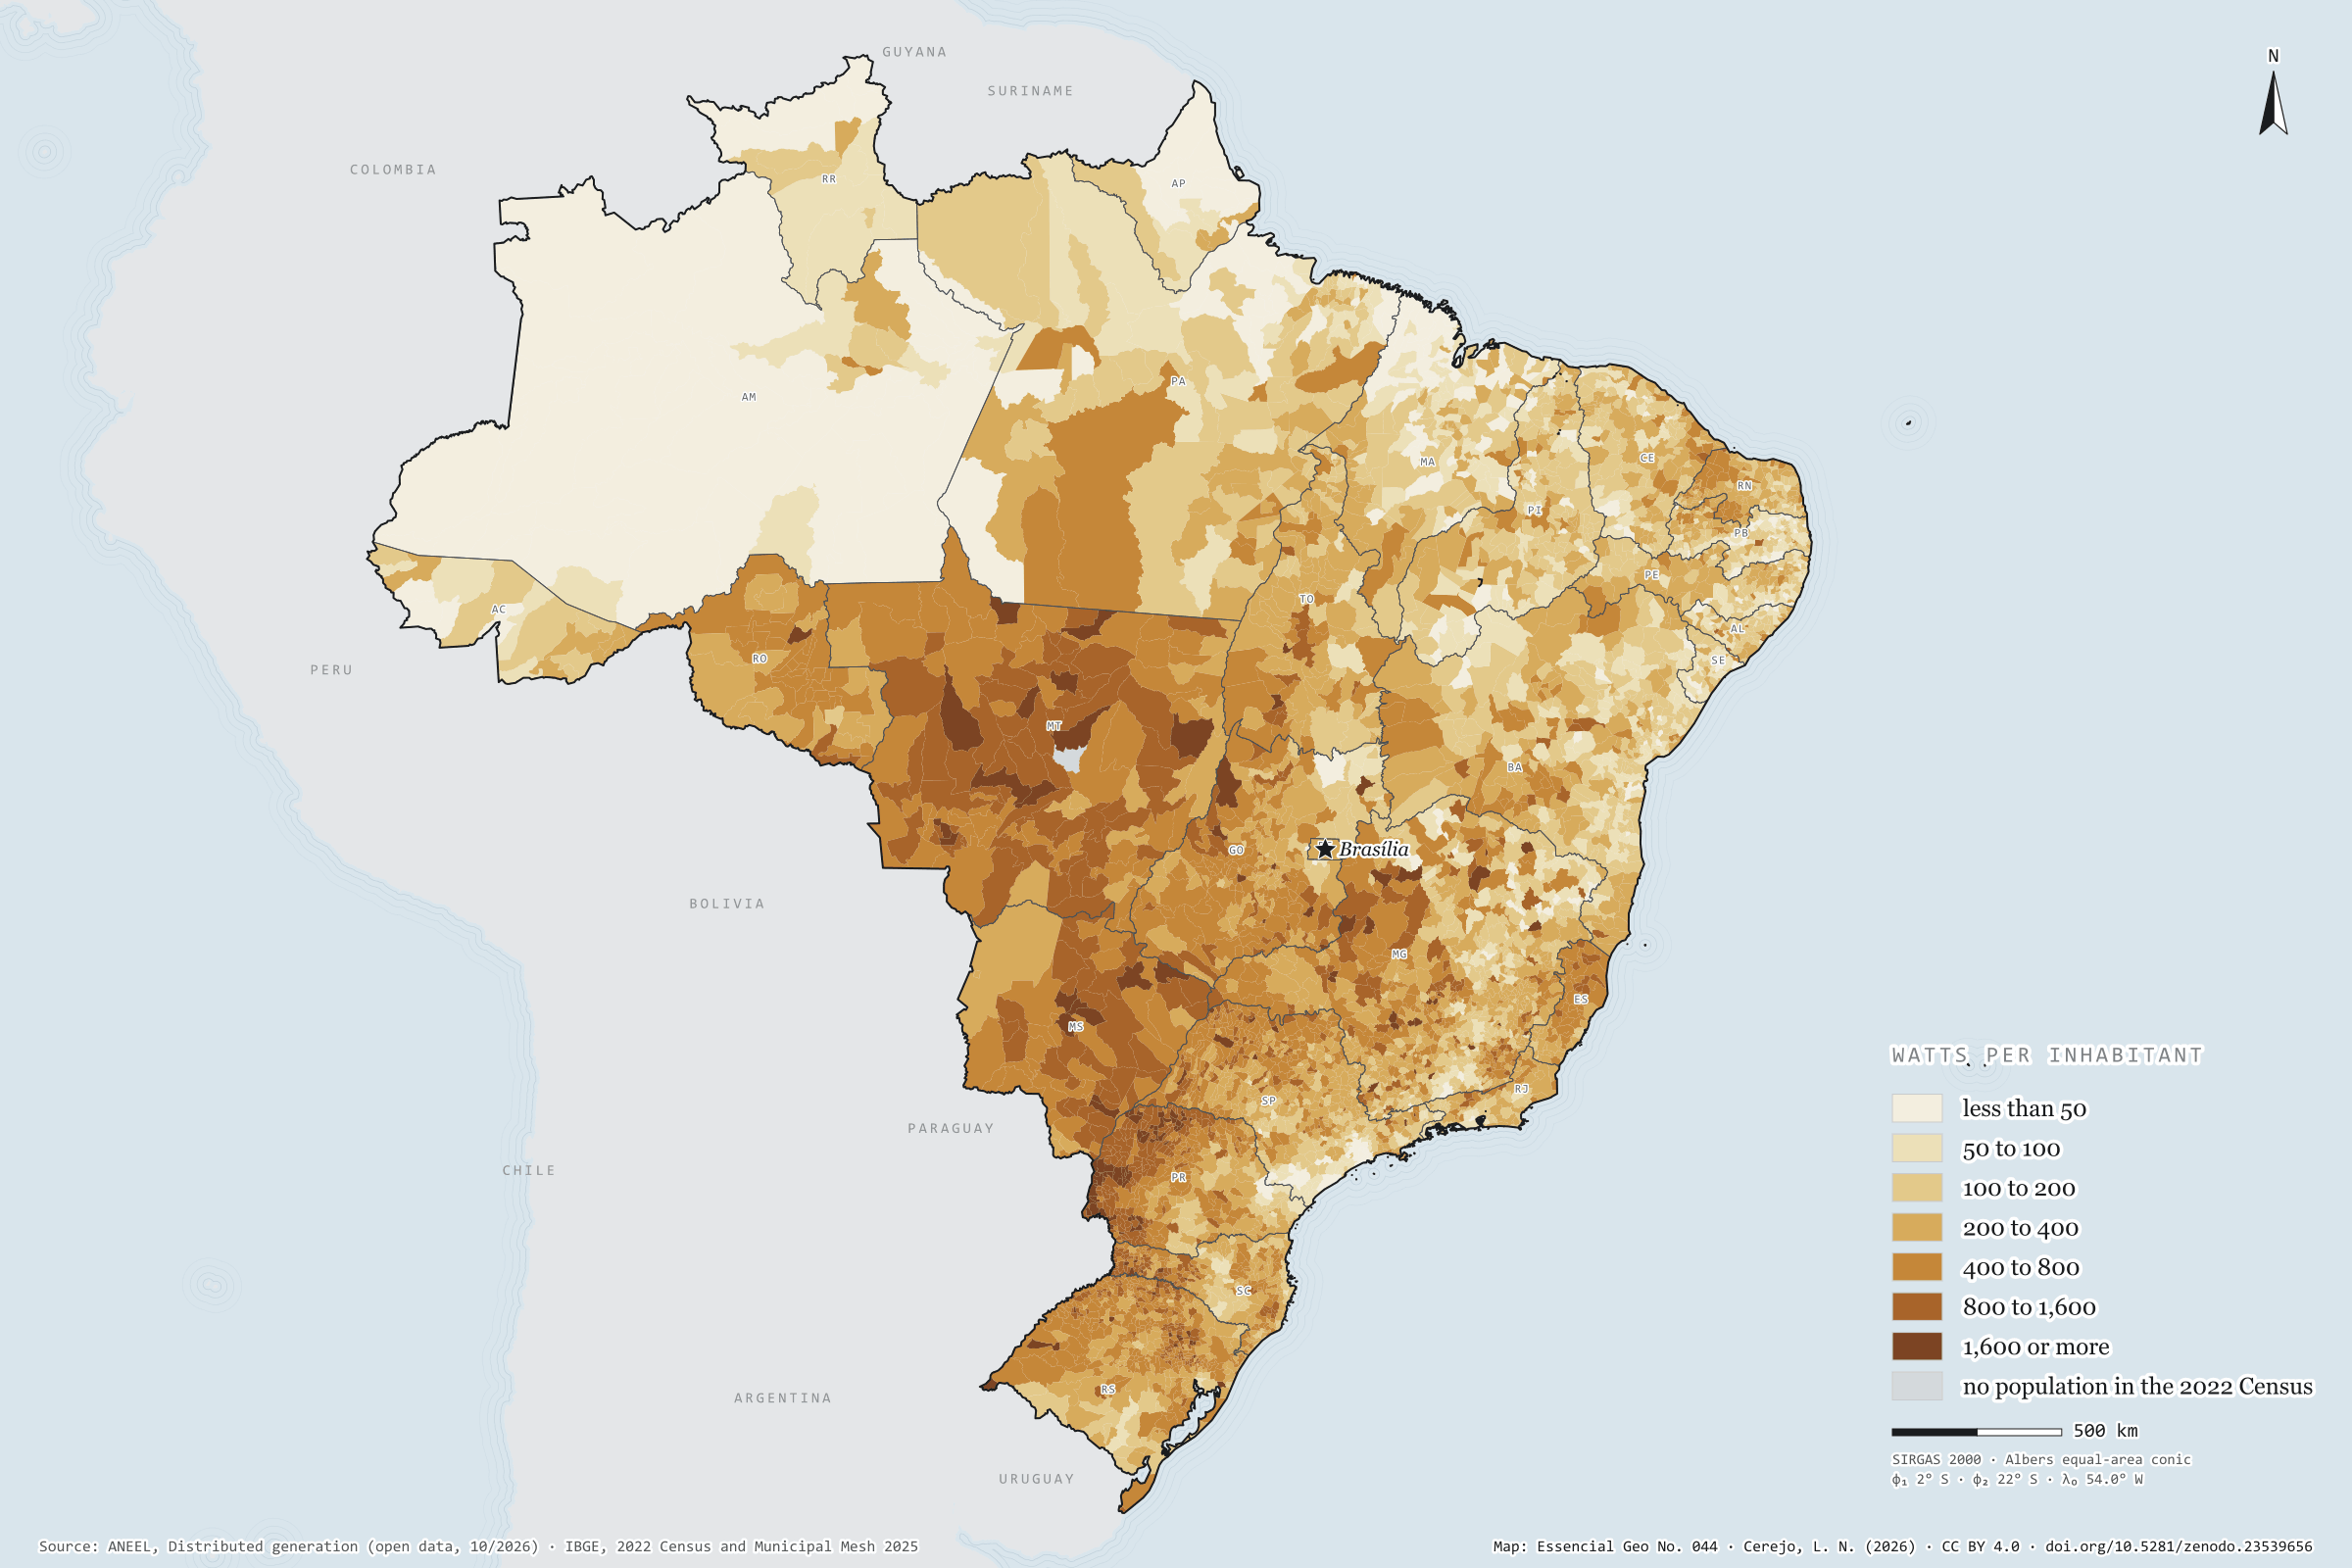
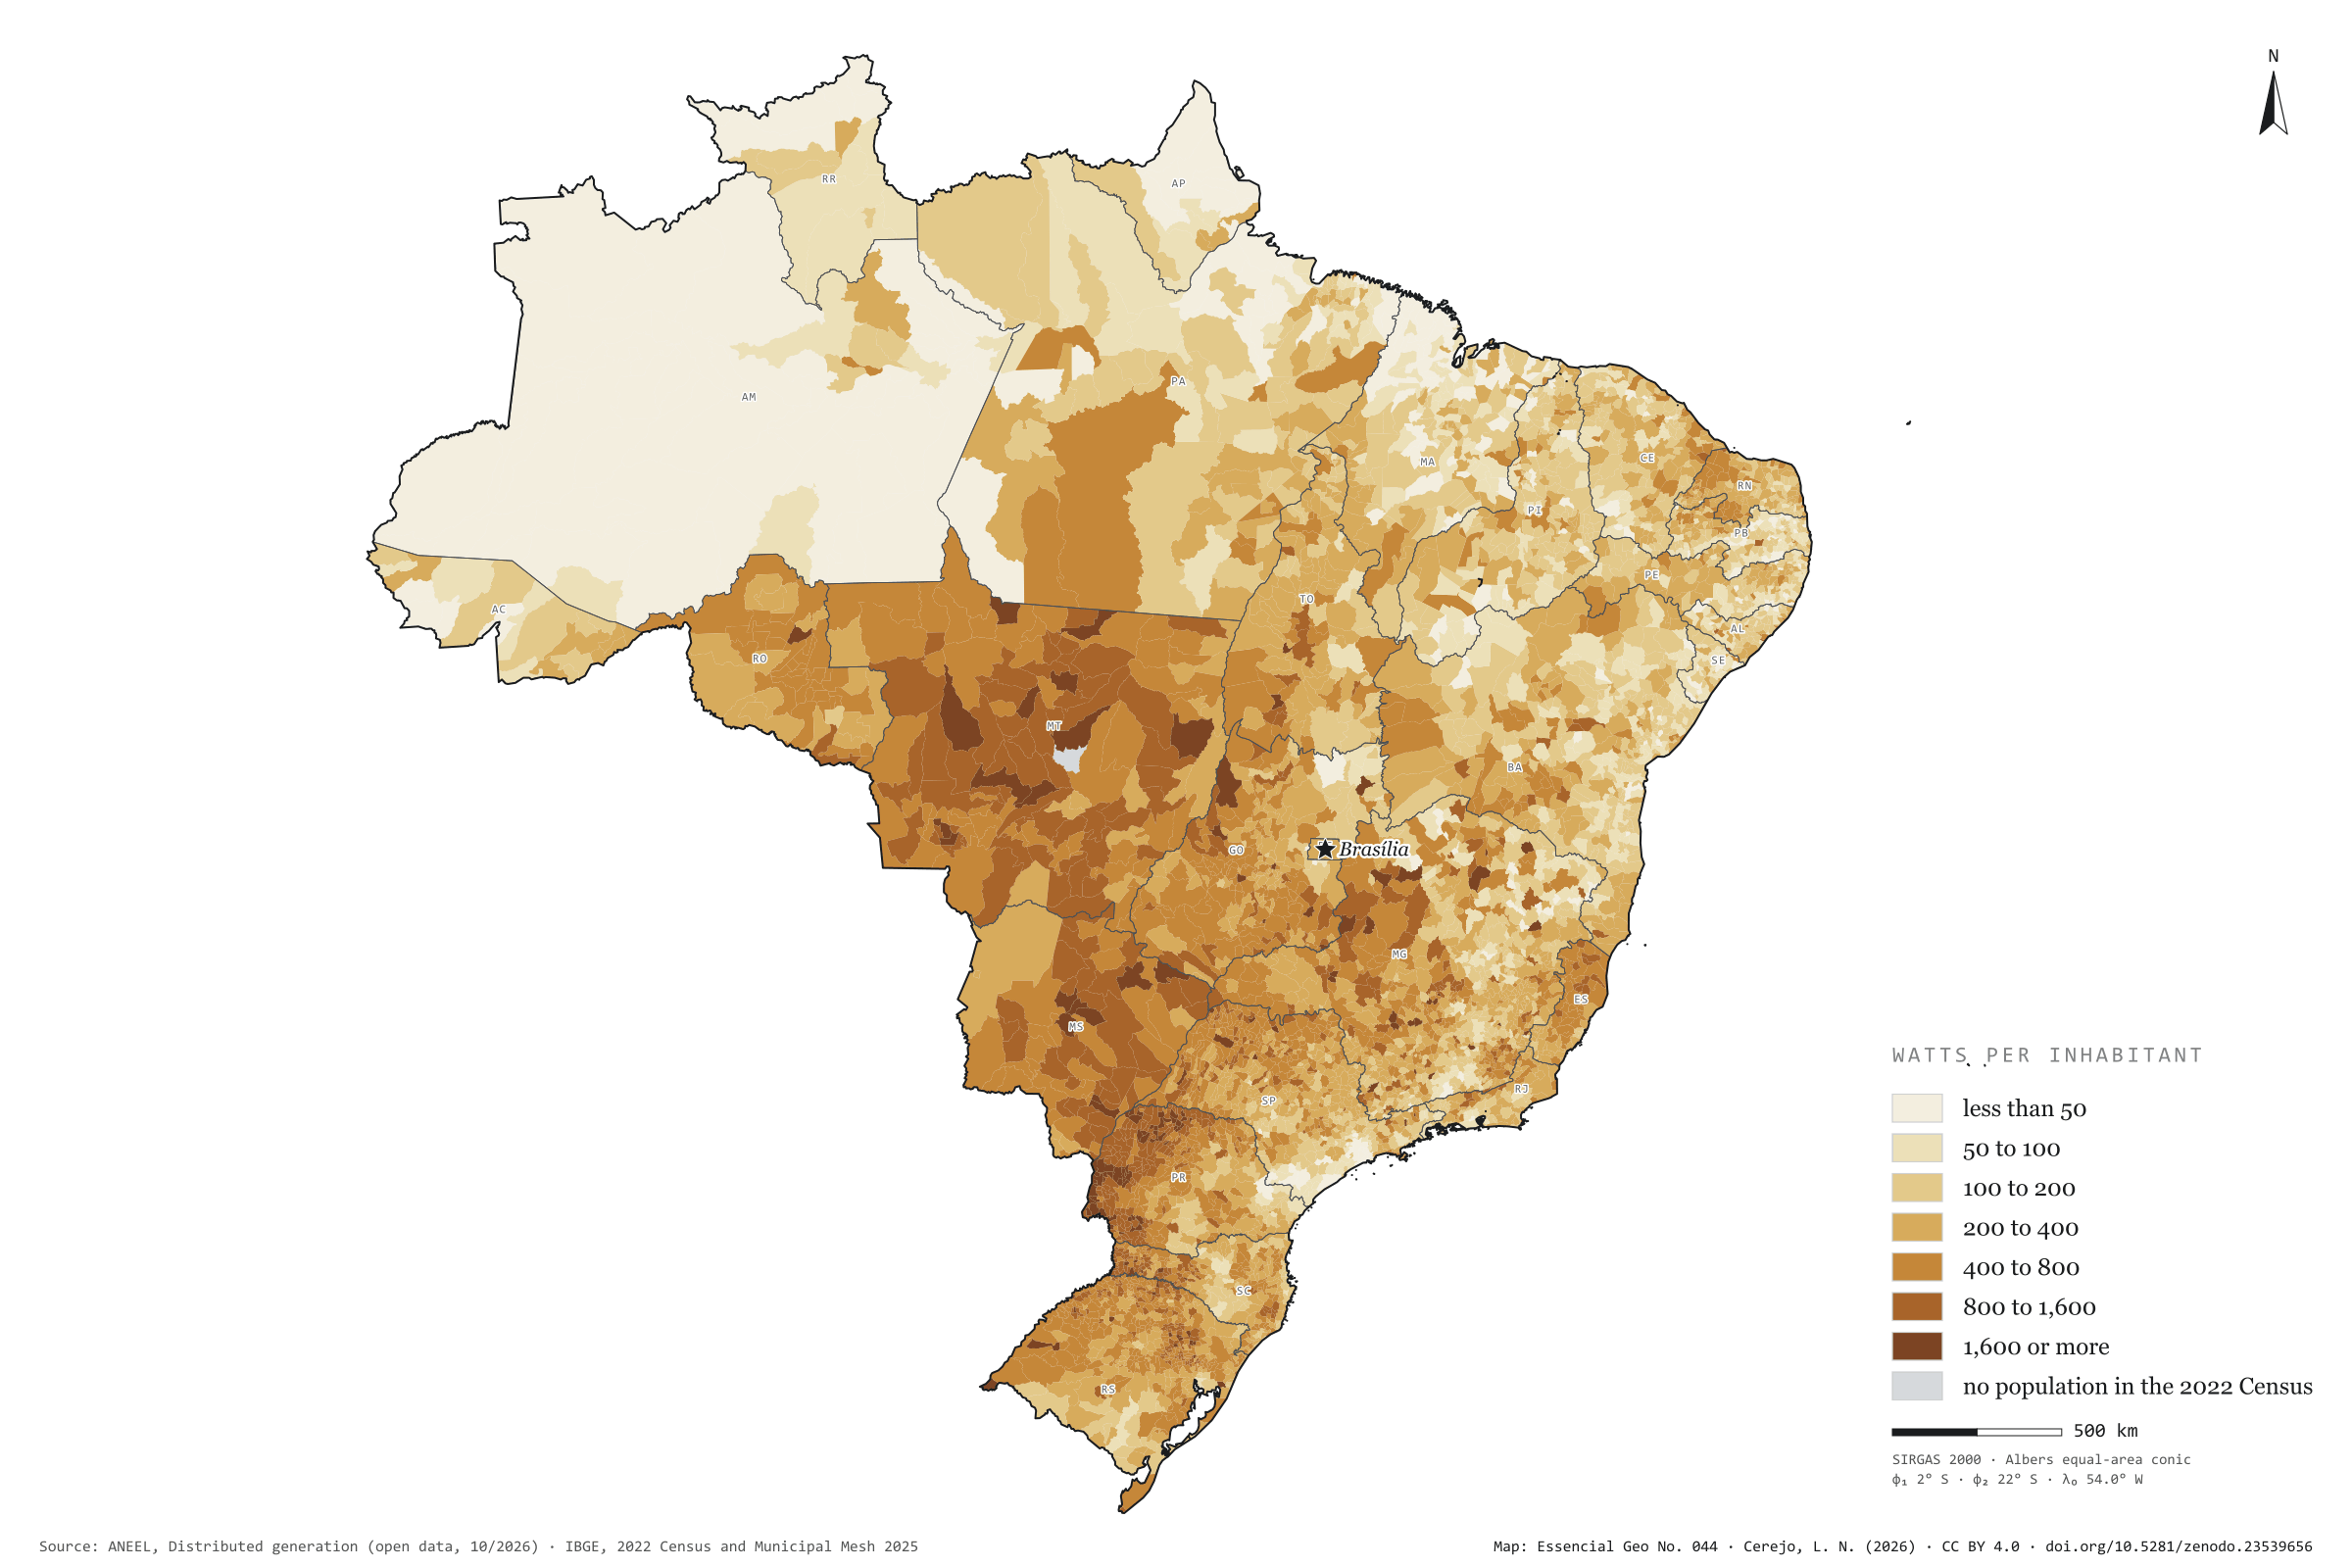
There are 4.67 million photovoltaic systems in 5,567 municipalities: panels on the roofs of homes, shops and smallholdings, and small plants of up to 5 MW that cut their owners’ electricity bills. They add up to 53.8 GW, 265 W per inhabitant, 52% of it in homes. Rooftop sun is strongest in the Centre-West and western Paraná: Mato Grosso has 872 W per inhabitant, and Foz do Iguaçu, with 1,408 W, leads among towns of more than 100,000 people. São Paulo has the largest capacity, 7.6 GW, but only 170 W per inhabitant; Taboão da Serra stands at 11 W. At the other extreme, the 20.6 MW of Santa Clara d’Oeste give 7,939 W to each of its 2,598 residents. Last plate of the collection “Electricity in Brazil”.
Technical record · downloads · citation
At a glance
Solar capacity in distributed generation
54GW
4,665,874 systems, 265 W per inhabitant
Capacity by consumer class (GW) (GW)
Residencial52.3%
Comercial26.6%
Rural12.4%
Industrial6.8%
Poder público1.2%
Outras0.8%
Watts per inhabitant, the five highest and five lowest states (W)
MT872
MS700
PR600
TO503
RO492
PB165
MA164
SE144
RJ128
AM115
Layers
municipiospolygon5,571 municipalities: population, number of solar systems, total capacity, by size, residential and remote self-consumption (kW), units receiving credit, watts per inhabitant and class
Capacity of photovoltaic micro- and mini-generation systems summed by municipality, divided by the 2022 Census population and grouped into seven classes of watts per inhabitant.
The map without a frame, with legend, scale, reference system and credit written on it: ready for papers, lectures and slides. In two versions: with the basemap (neighbours and sea) or only the mapped area, on white.
CEREJO, Lucas Nakamura. Geração solar distribuída: o sol que mora nos telhados. Versão 1.0.0. [S. l.]: Zenodo, 2026. Conjunto de dados. DOI: 10.5281/zenodo.23539656. Disponível em: https://doi.org/10.5281/zenodo.23539656. Acesso em: 10 nov. 2026.
Cerejo, L. N. (2026). Geração solar distribuída: o sol que mora nos telhados [Distributed solar generation: The sun that lives on the rooftops] (Version 1.0.0) [Data set]. Zenodo. https://doi.org/10.5281/zenodo.23539656
@dataset{cerejo2026_geracao_solar_distribuida_brasil,
  author    = {Cerejo, Lucas Nakamura},
  title     = {Geração solar distribuída: O sol que mora nos telhados},
  year      = {2026},
  publisher = {Zenodo},
  version   = {1.0.0},
  doi       = {10.5281/zenodo.23539656},
  url       = {https://doi.org/10.5281/zenodo.23539656},
  language  = {portuguese},
  note      = {English title: Distributed solar generation: The sun that lives on the rooftops. Licence CC BY 4.0}
}
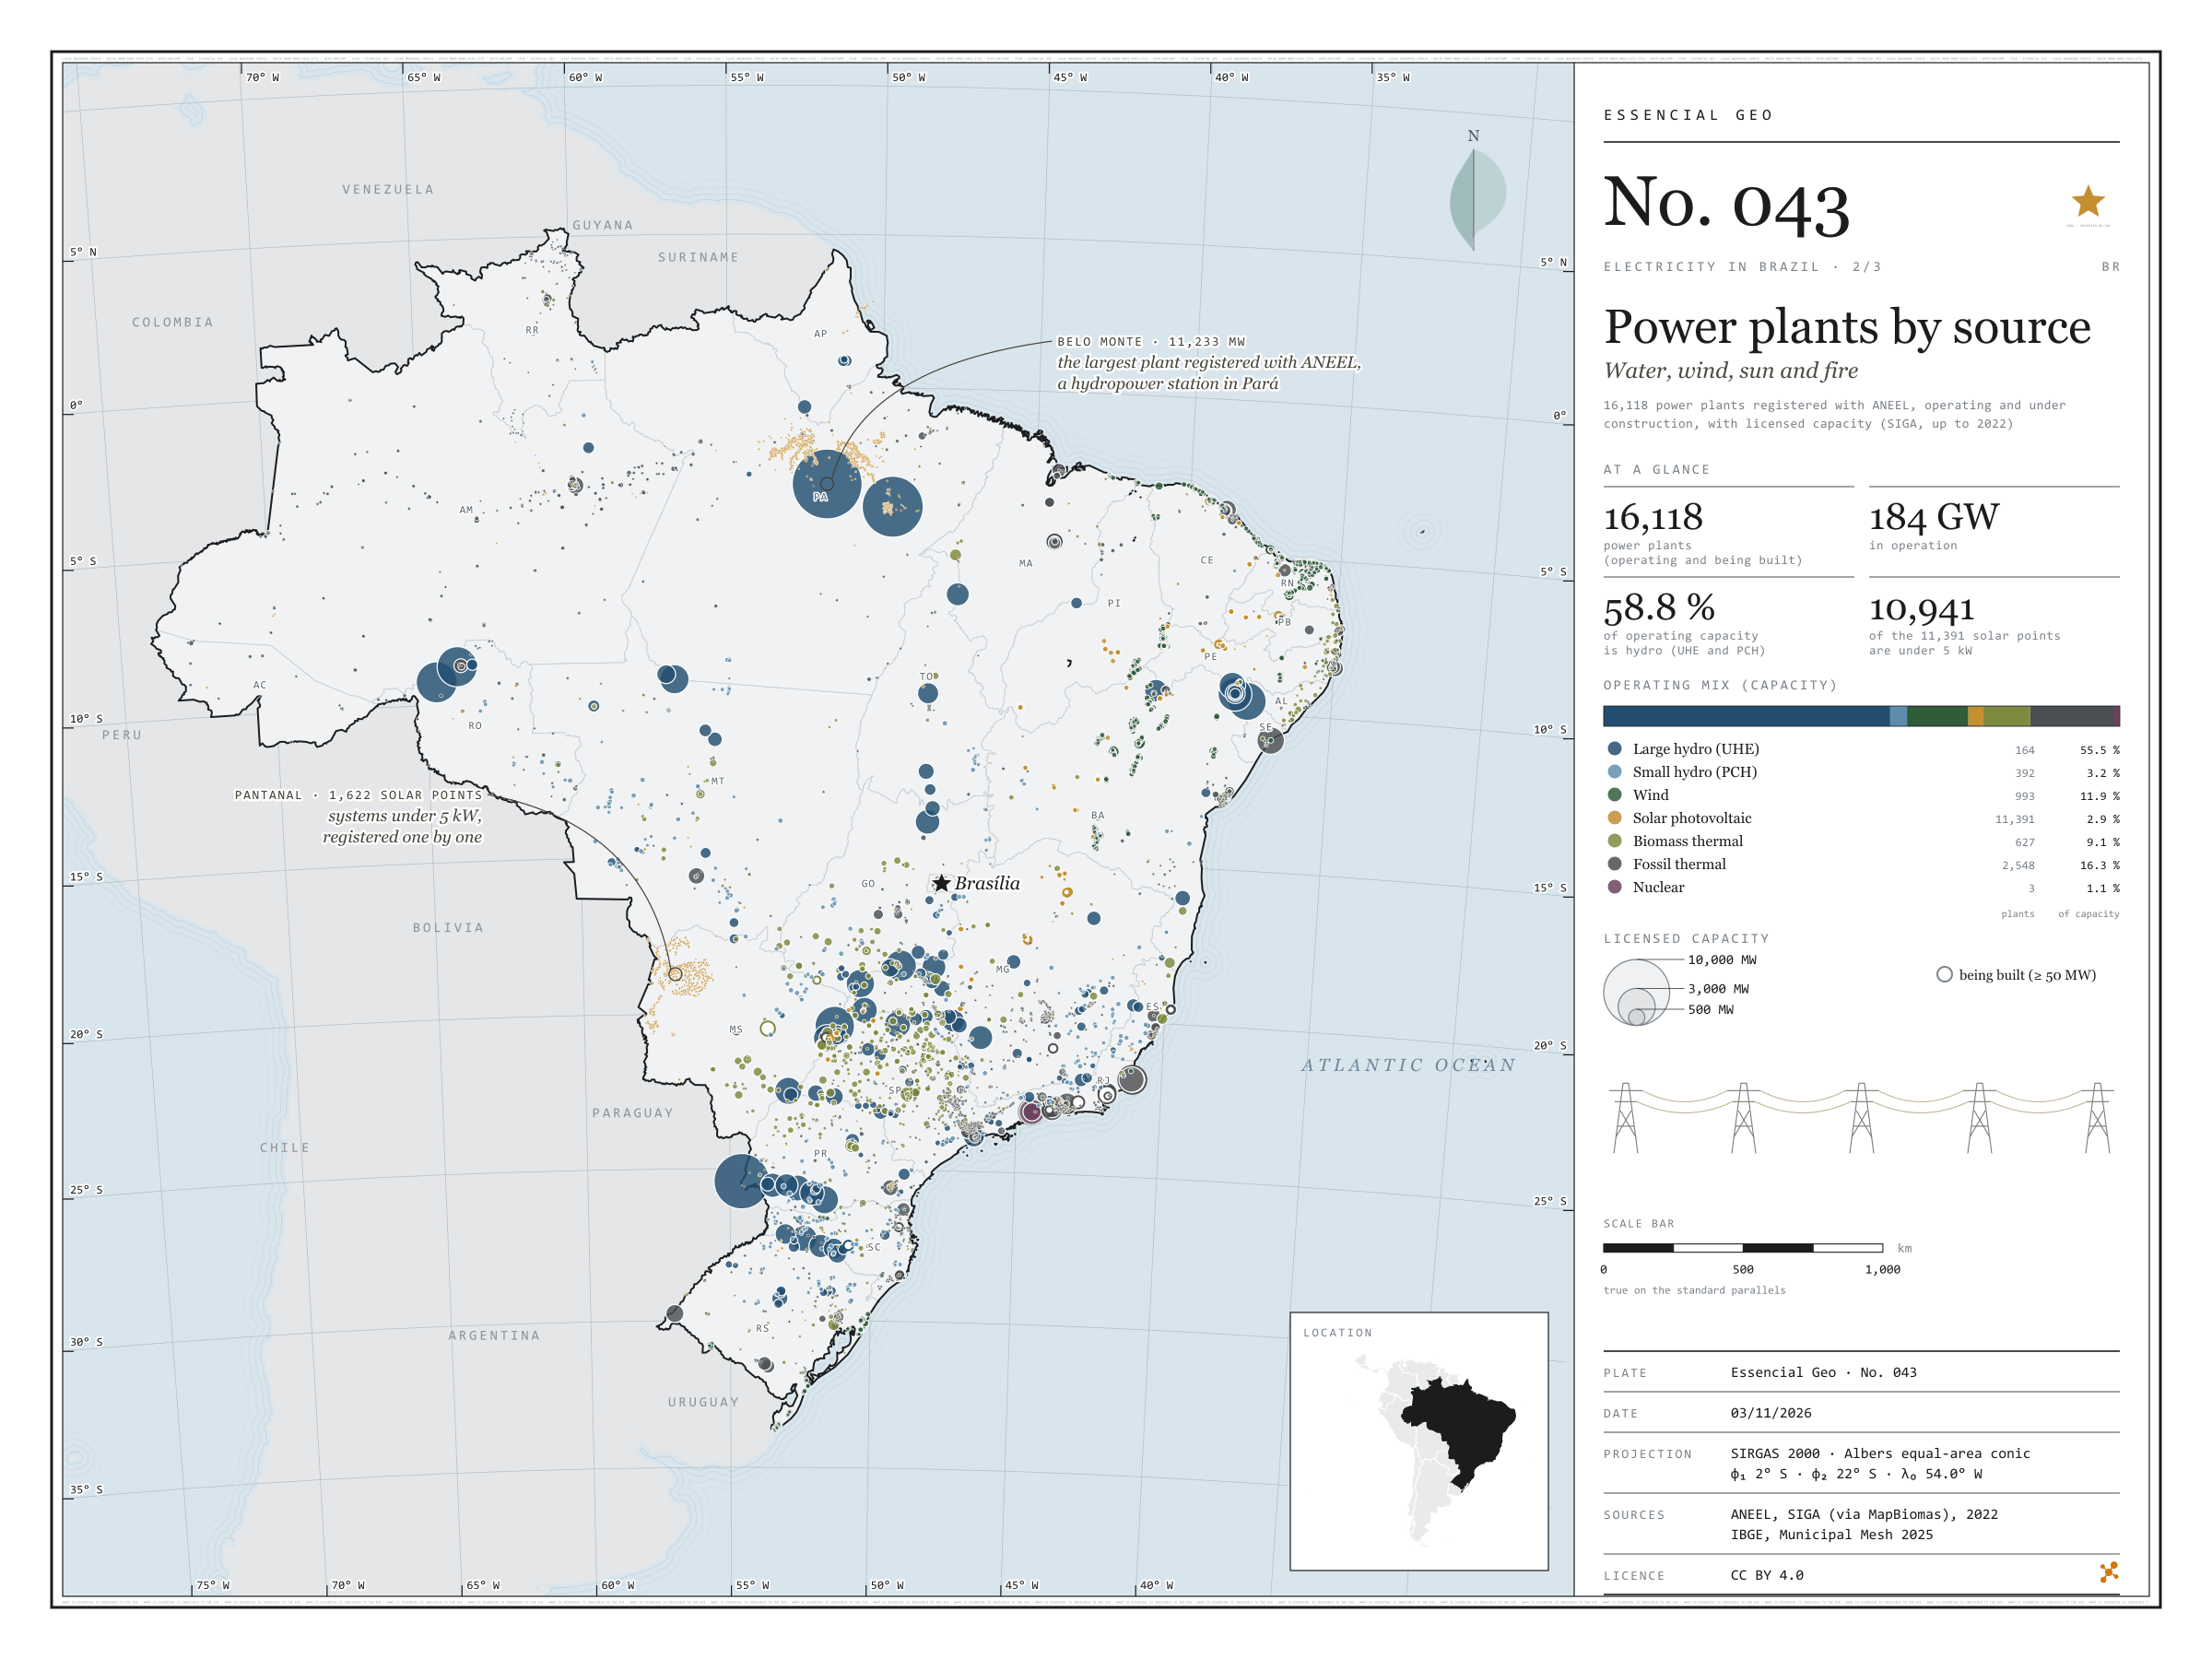
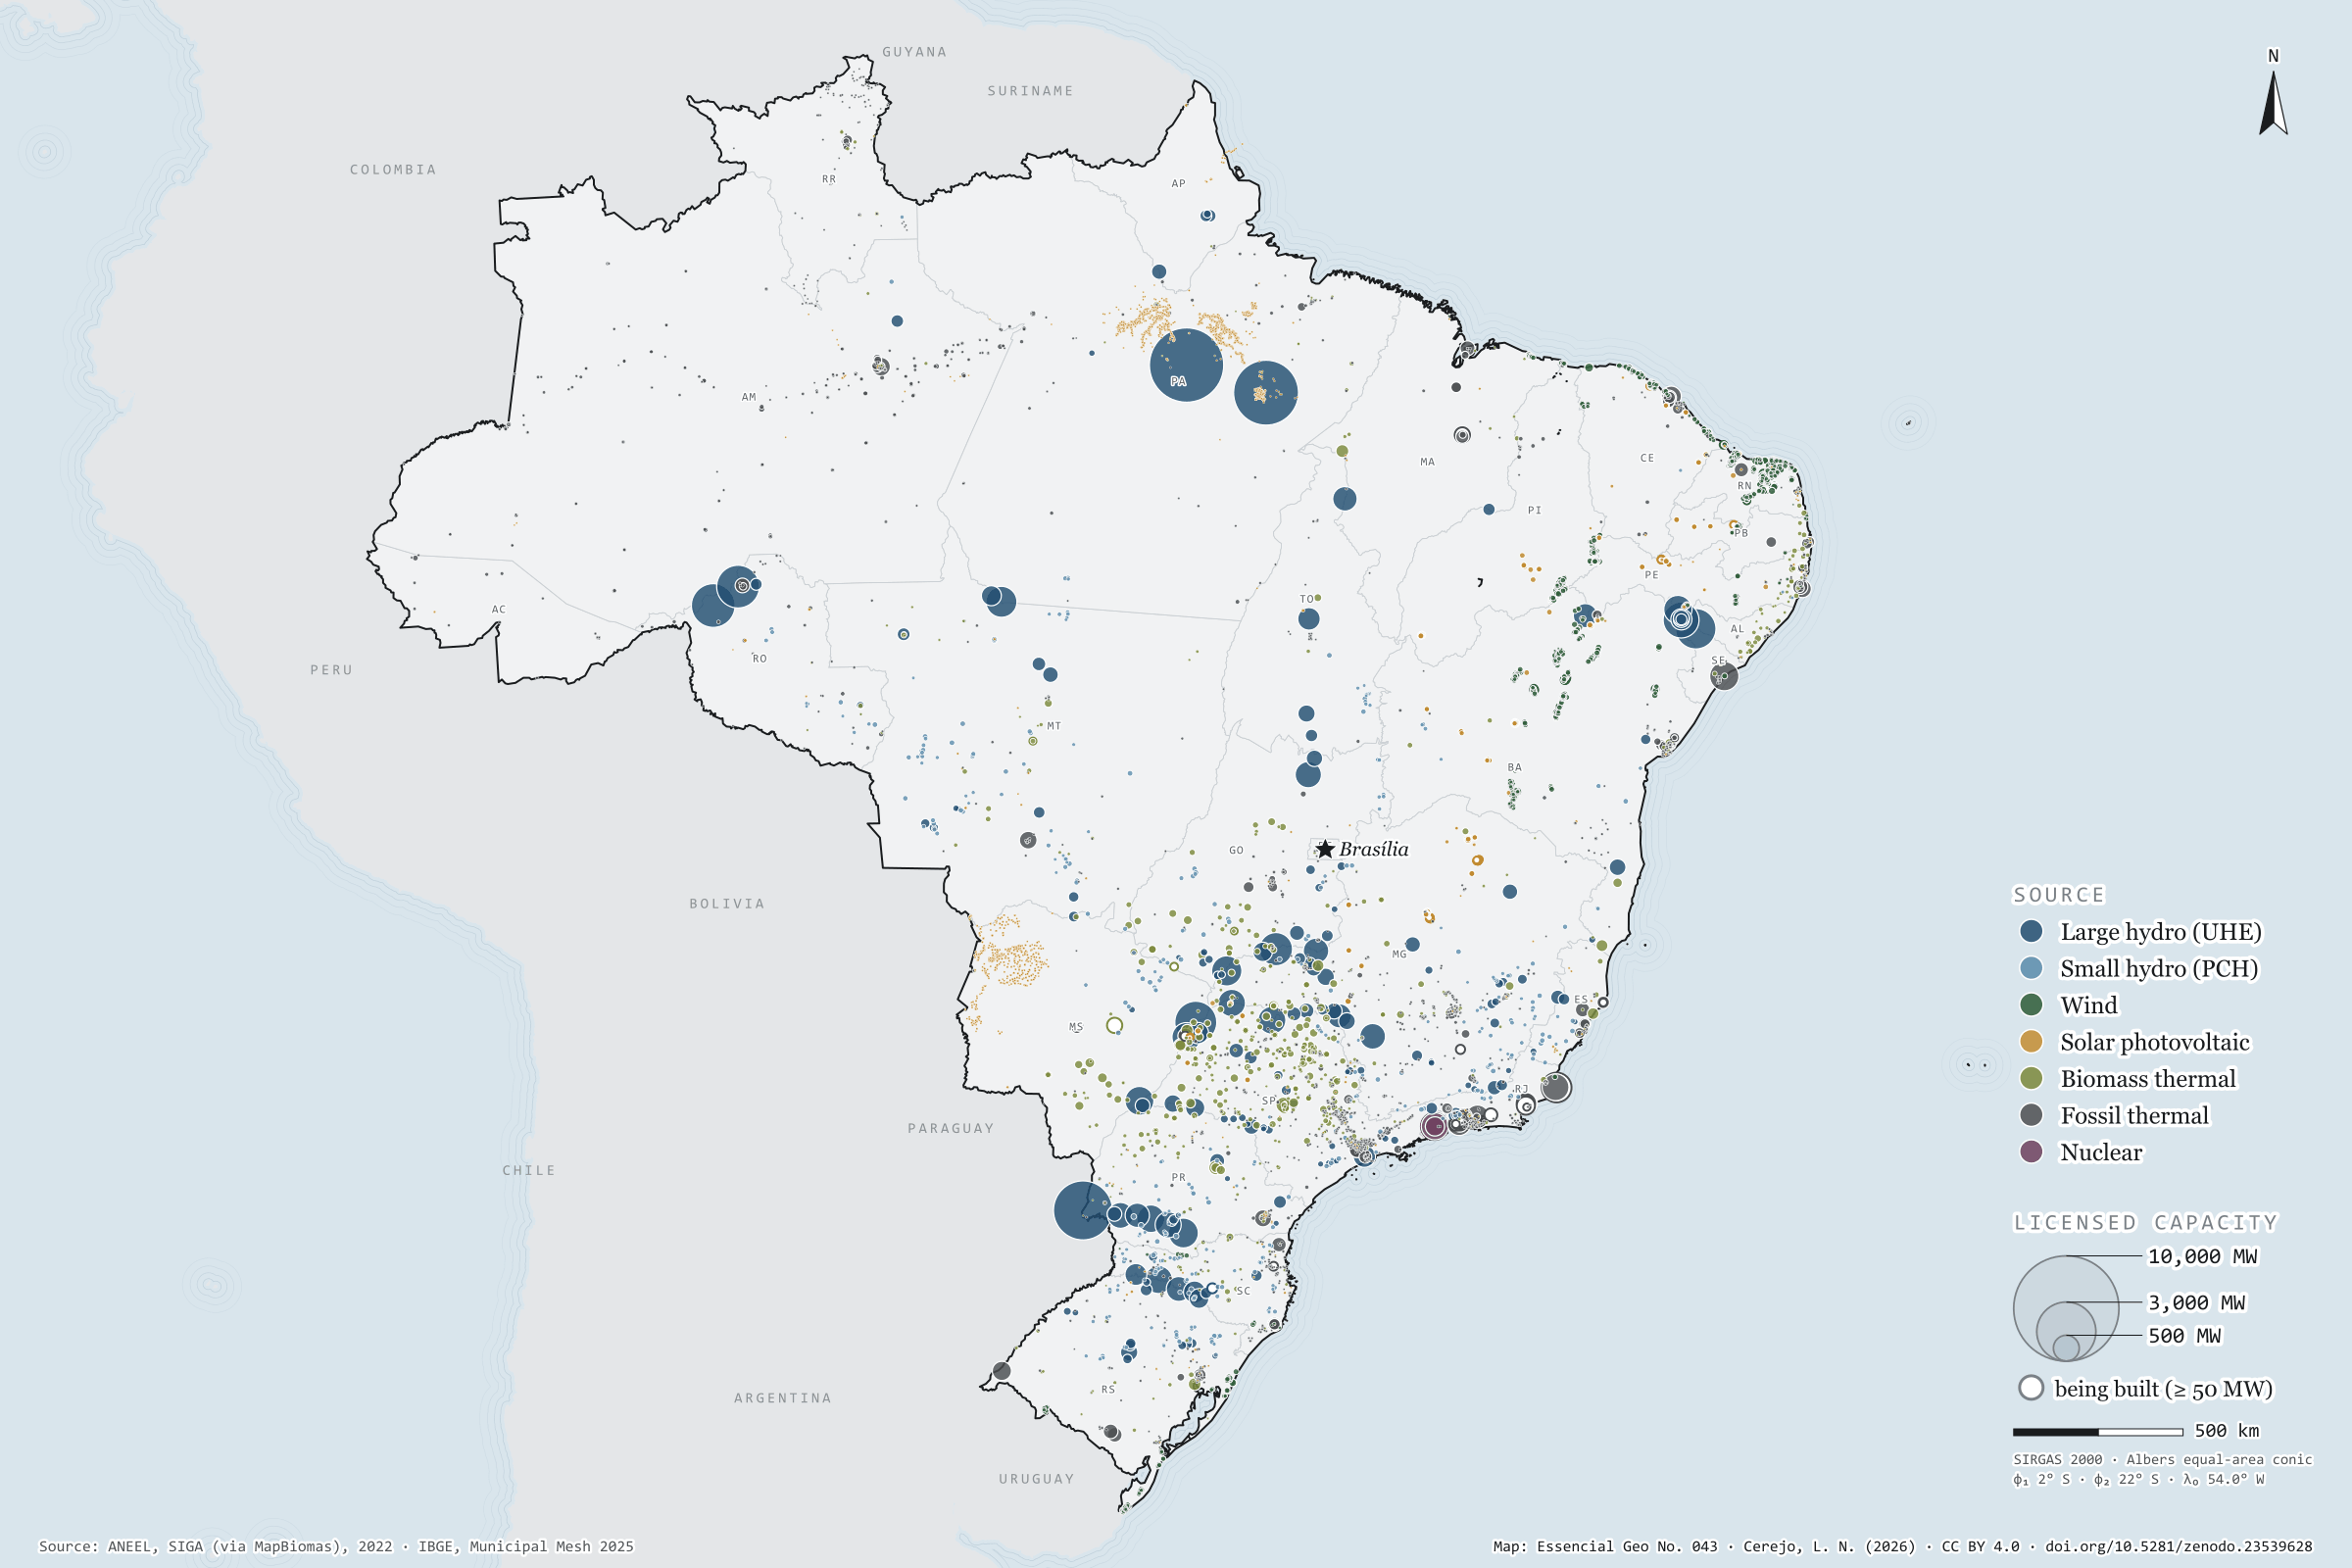
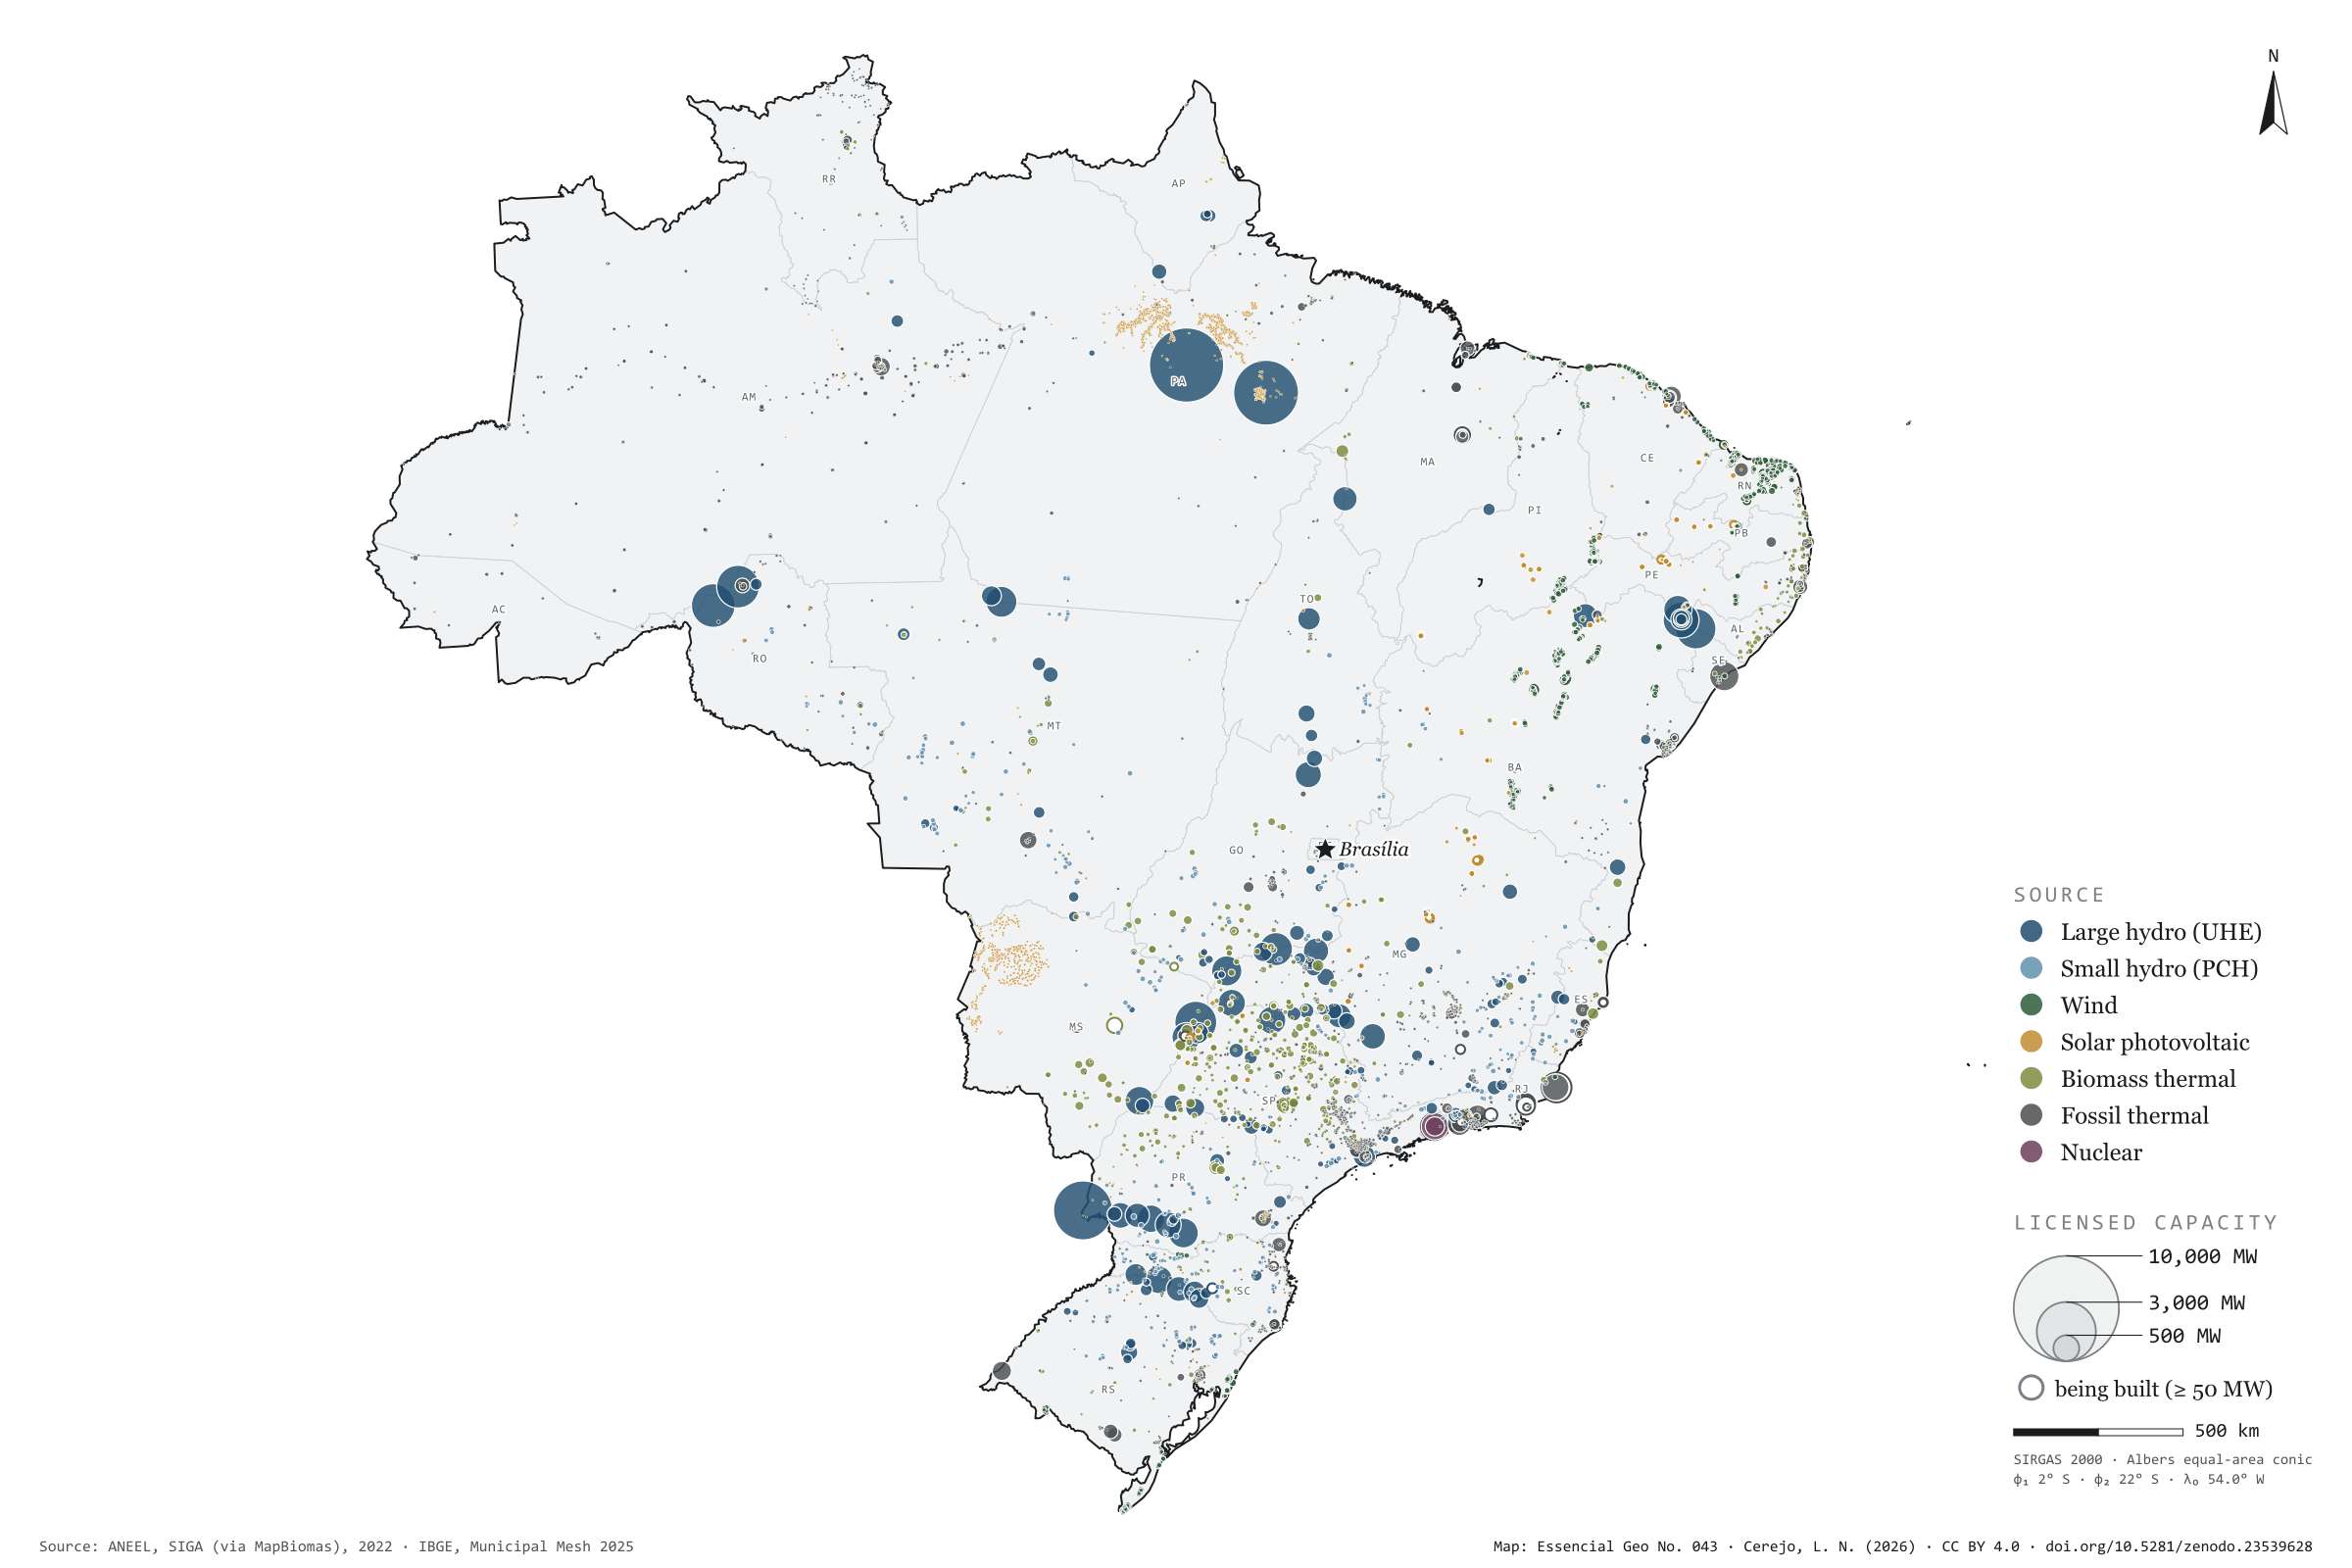
Belo Monte, on the Xingu, has 11,233 MW of licensed capacity: it is the largest of the 16,118 power plants registered with ANEEL, operating or under construction. Water still dominates: large and small hydro add up to 58.8% of the 184 GW in operation. In the smaller circles, the map tells other stories. The wind lines up 89% of the 993 wind farms in the North-East; sugarcane bagasse fires 427 of the 627 biomass power stations, 237 of them in São Paulo; and Angra 3 is still being built beside the other two. Of the 11,391 solar plants, 10,941 are under 5 kW: individual systems registered one by one by the distribution companies, nearly all in Pará and in the Pantanal of Mato Grosso do Sul. Second plate of the collection “Electricity in Brazil”.
Technical record · downloads · citation
At a glance
Operating mix, by licensed capacity (GW) (GW)
Hidrelétrica (UHE)55.5%
Pequena central hidrelétrica3.2%
Eólica11.9%
Solar fotovoltaica2.9%
Termelétrica a biomassa9.1%
Termelétrica fóssil16.3%
Termonuclear1.1%
Belo Monte, the largest registered plant
11,233MW
followed by Tucuruí (8,535 MW) and the Brazilian share of Itaipu (7,000 MW)
Layers
usinaspoint16,118 power plants: source, fuel, phase, licensed and inspected capacity (kW), start of operations, owner and state
The map without a frame, with legend, scale, reference system and credit written on it: ready for papers, lectures and slides. In two versions: with the basemap (neighbours and sea) or only the mapped area, on white.
CEREJO, Lucas Nakamura. Usinas por fonte: água, vento, sol e fogo. Versão 1.0.0. [S. l.]: Zenodo, 2026. Conjunto de dados. DOI: 10.5281/zenodo.23539628. Disponível em: https://doi.org/10.5281/zenodo.23539628. Acesso em: 10 nov. 2026.
Cerejo, L. N. (2026). Usinas por fonte: água, vento, sol e fogo [Power plants by source: Water, wind, sun and fire] (Version 1.0.0) [Data set]. Zenodo. https://doi.org/10.5281/zenodo.23539628
@dataset{cerejo2026_usinas_por_fonte_brasil,
  author    = {Cerejo, Lucas Nakamura},
  title     = {Usinas por fonte: Água, vento, sol e fogo},
  year      = {2026},
  publisher = {Zenodo},
  version   = {1.0.0},
  doi       = {10.5281/zenodo.23539628},
  url       = {https://doi.org/10.5281/zenodo.23539628},
  language  = {portuguese},
  note      = {English title: Power plants by source: Water, wind, sun and fire. Licence CC BY 4.0}
}
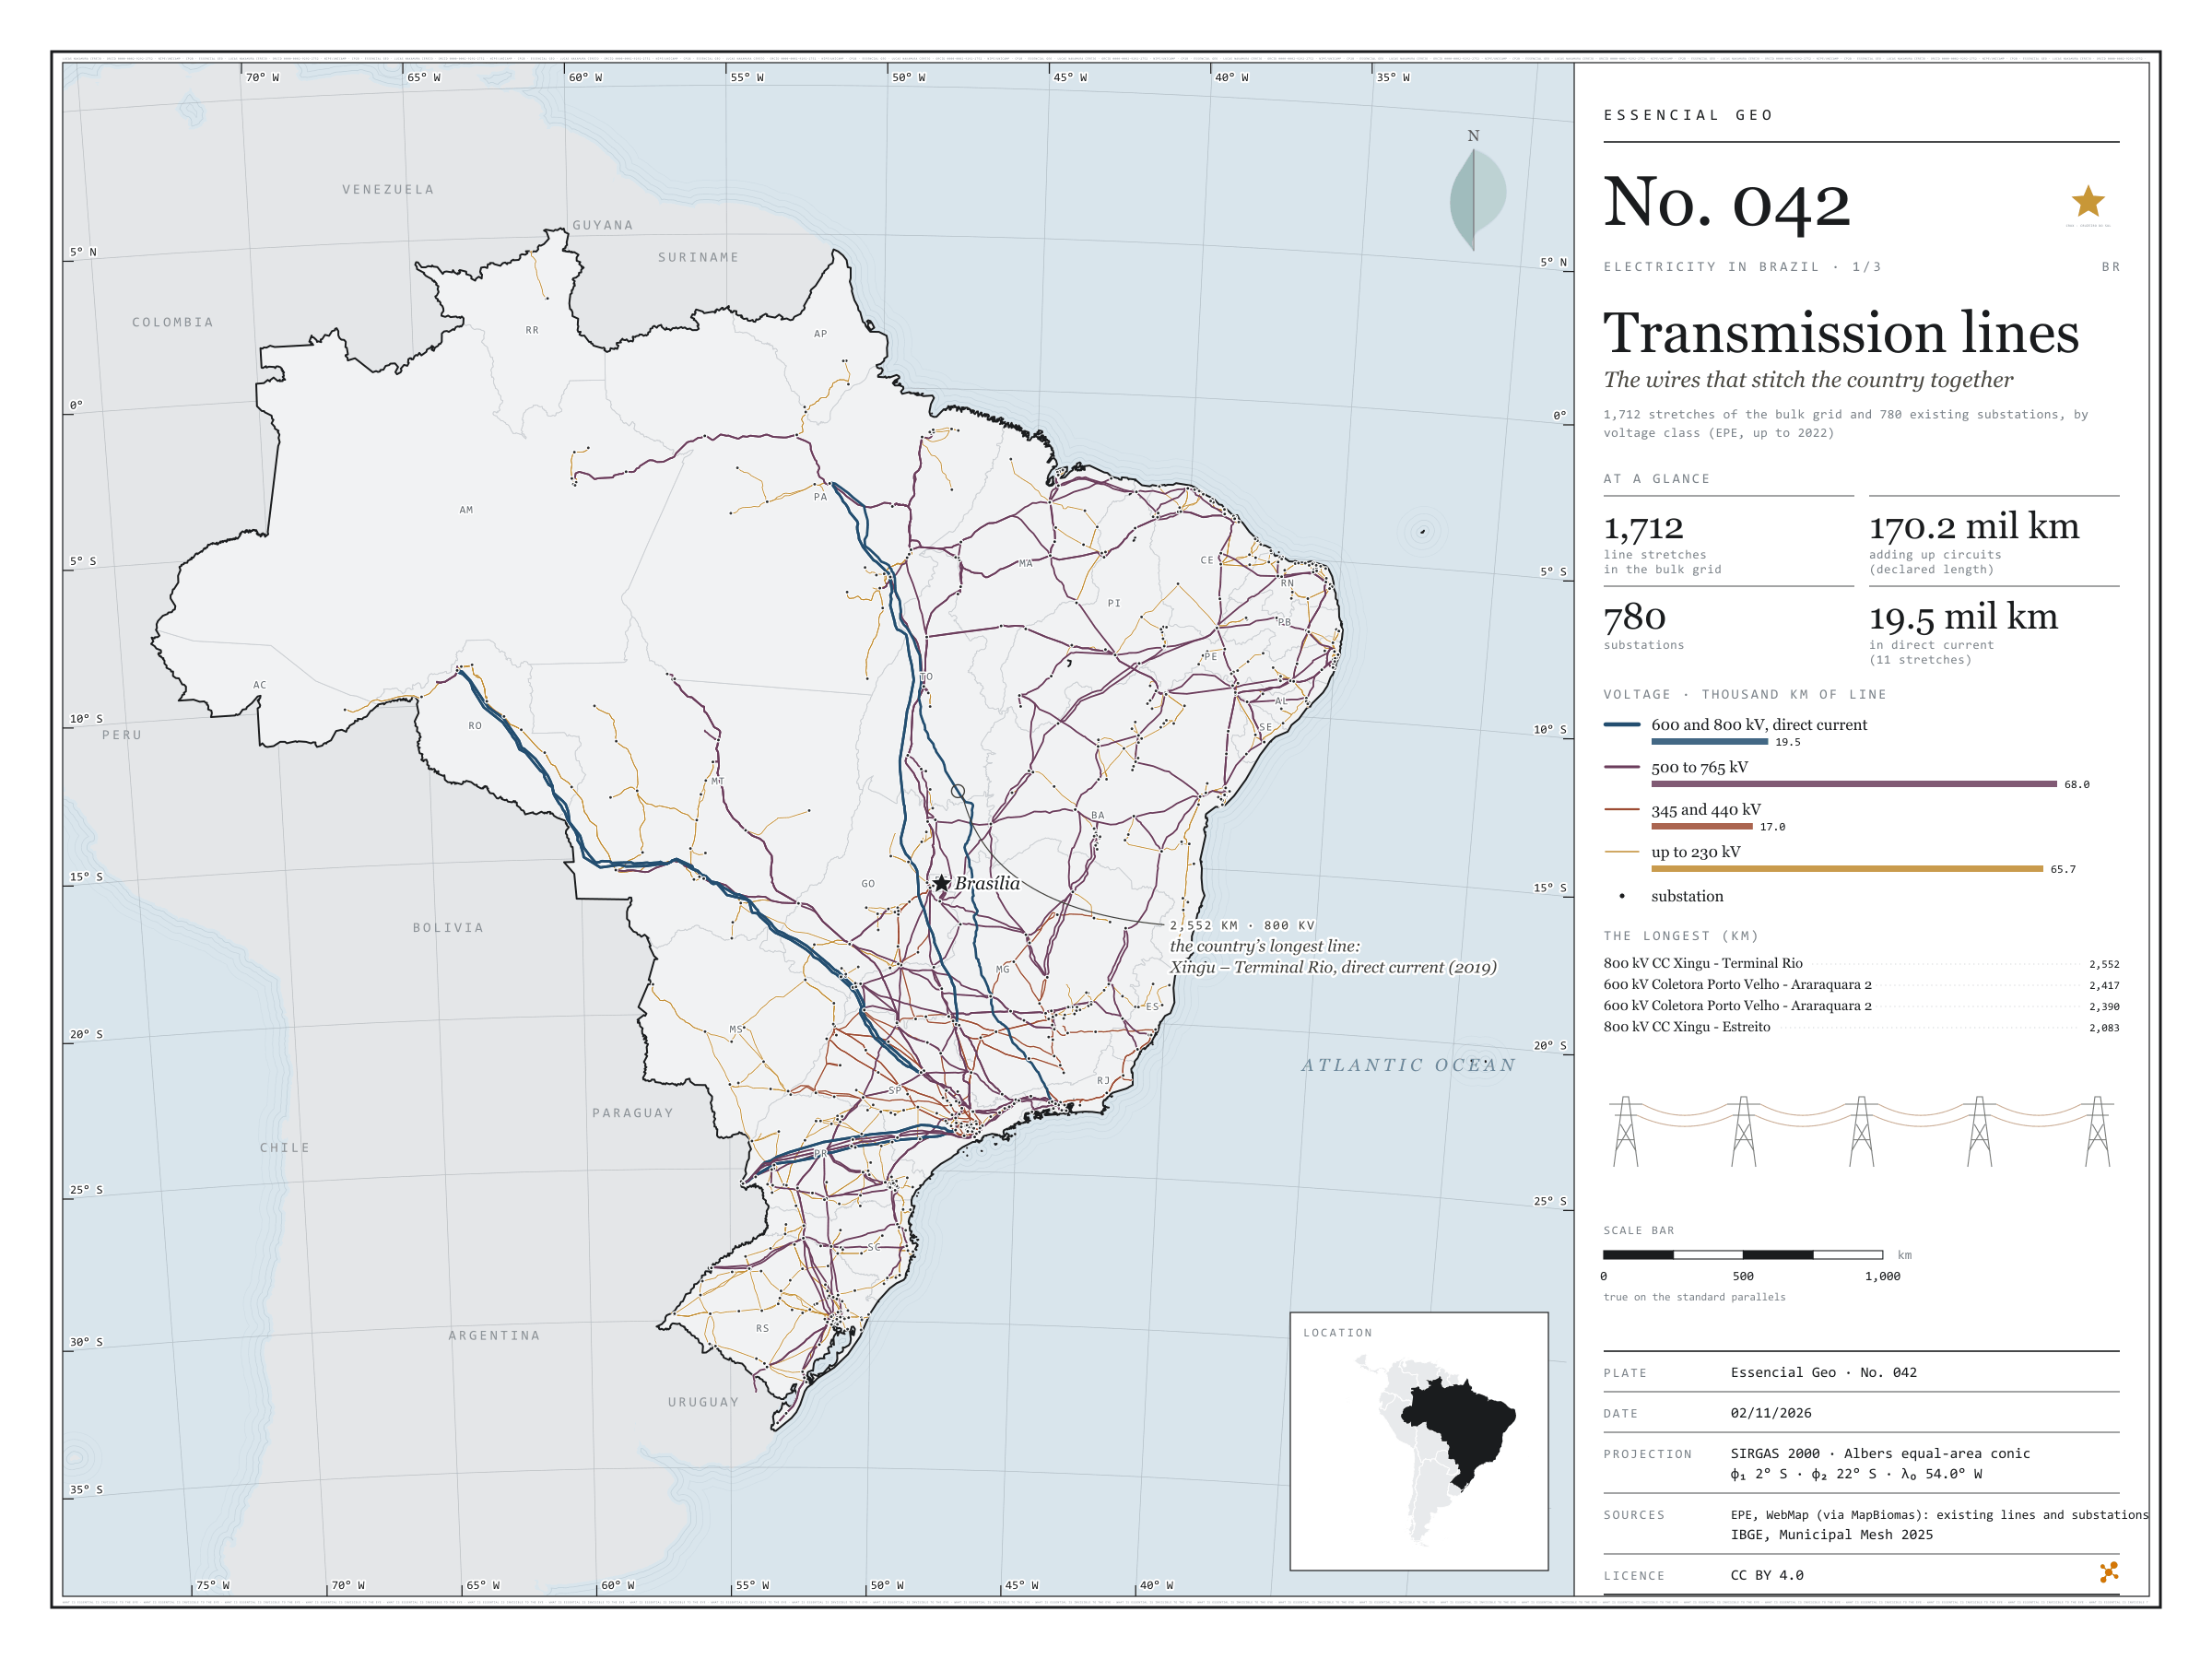
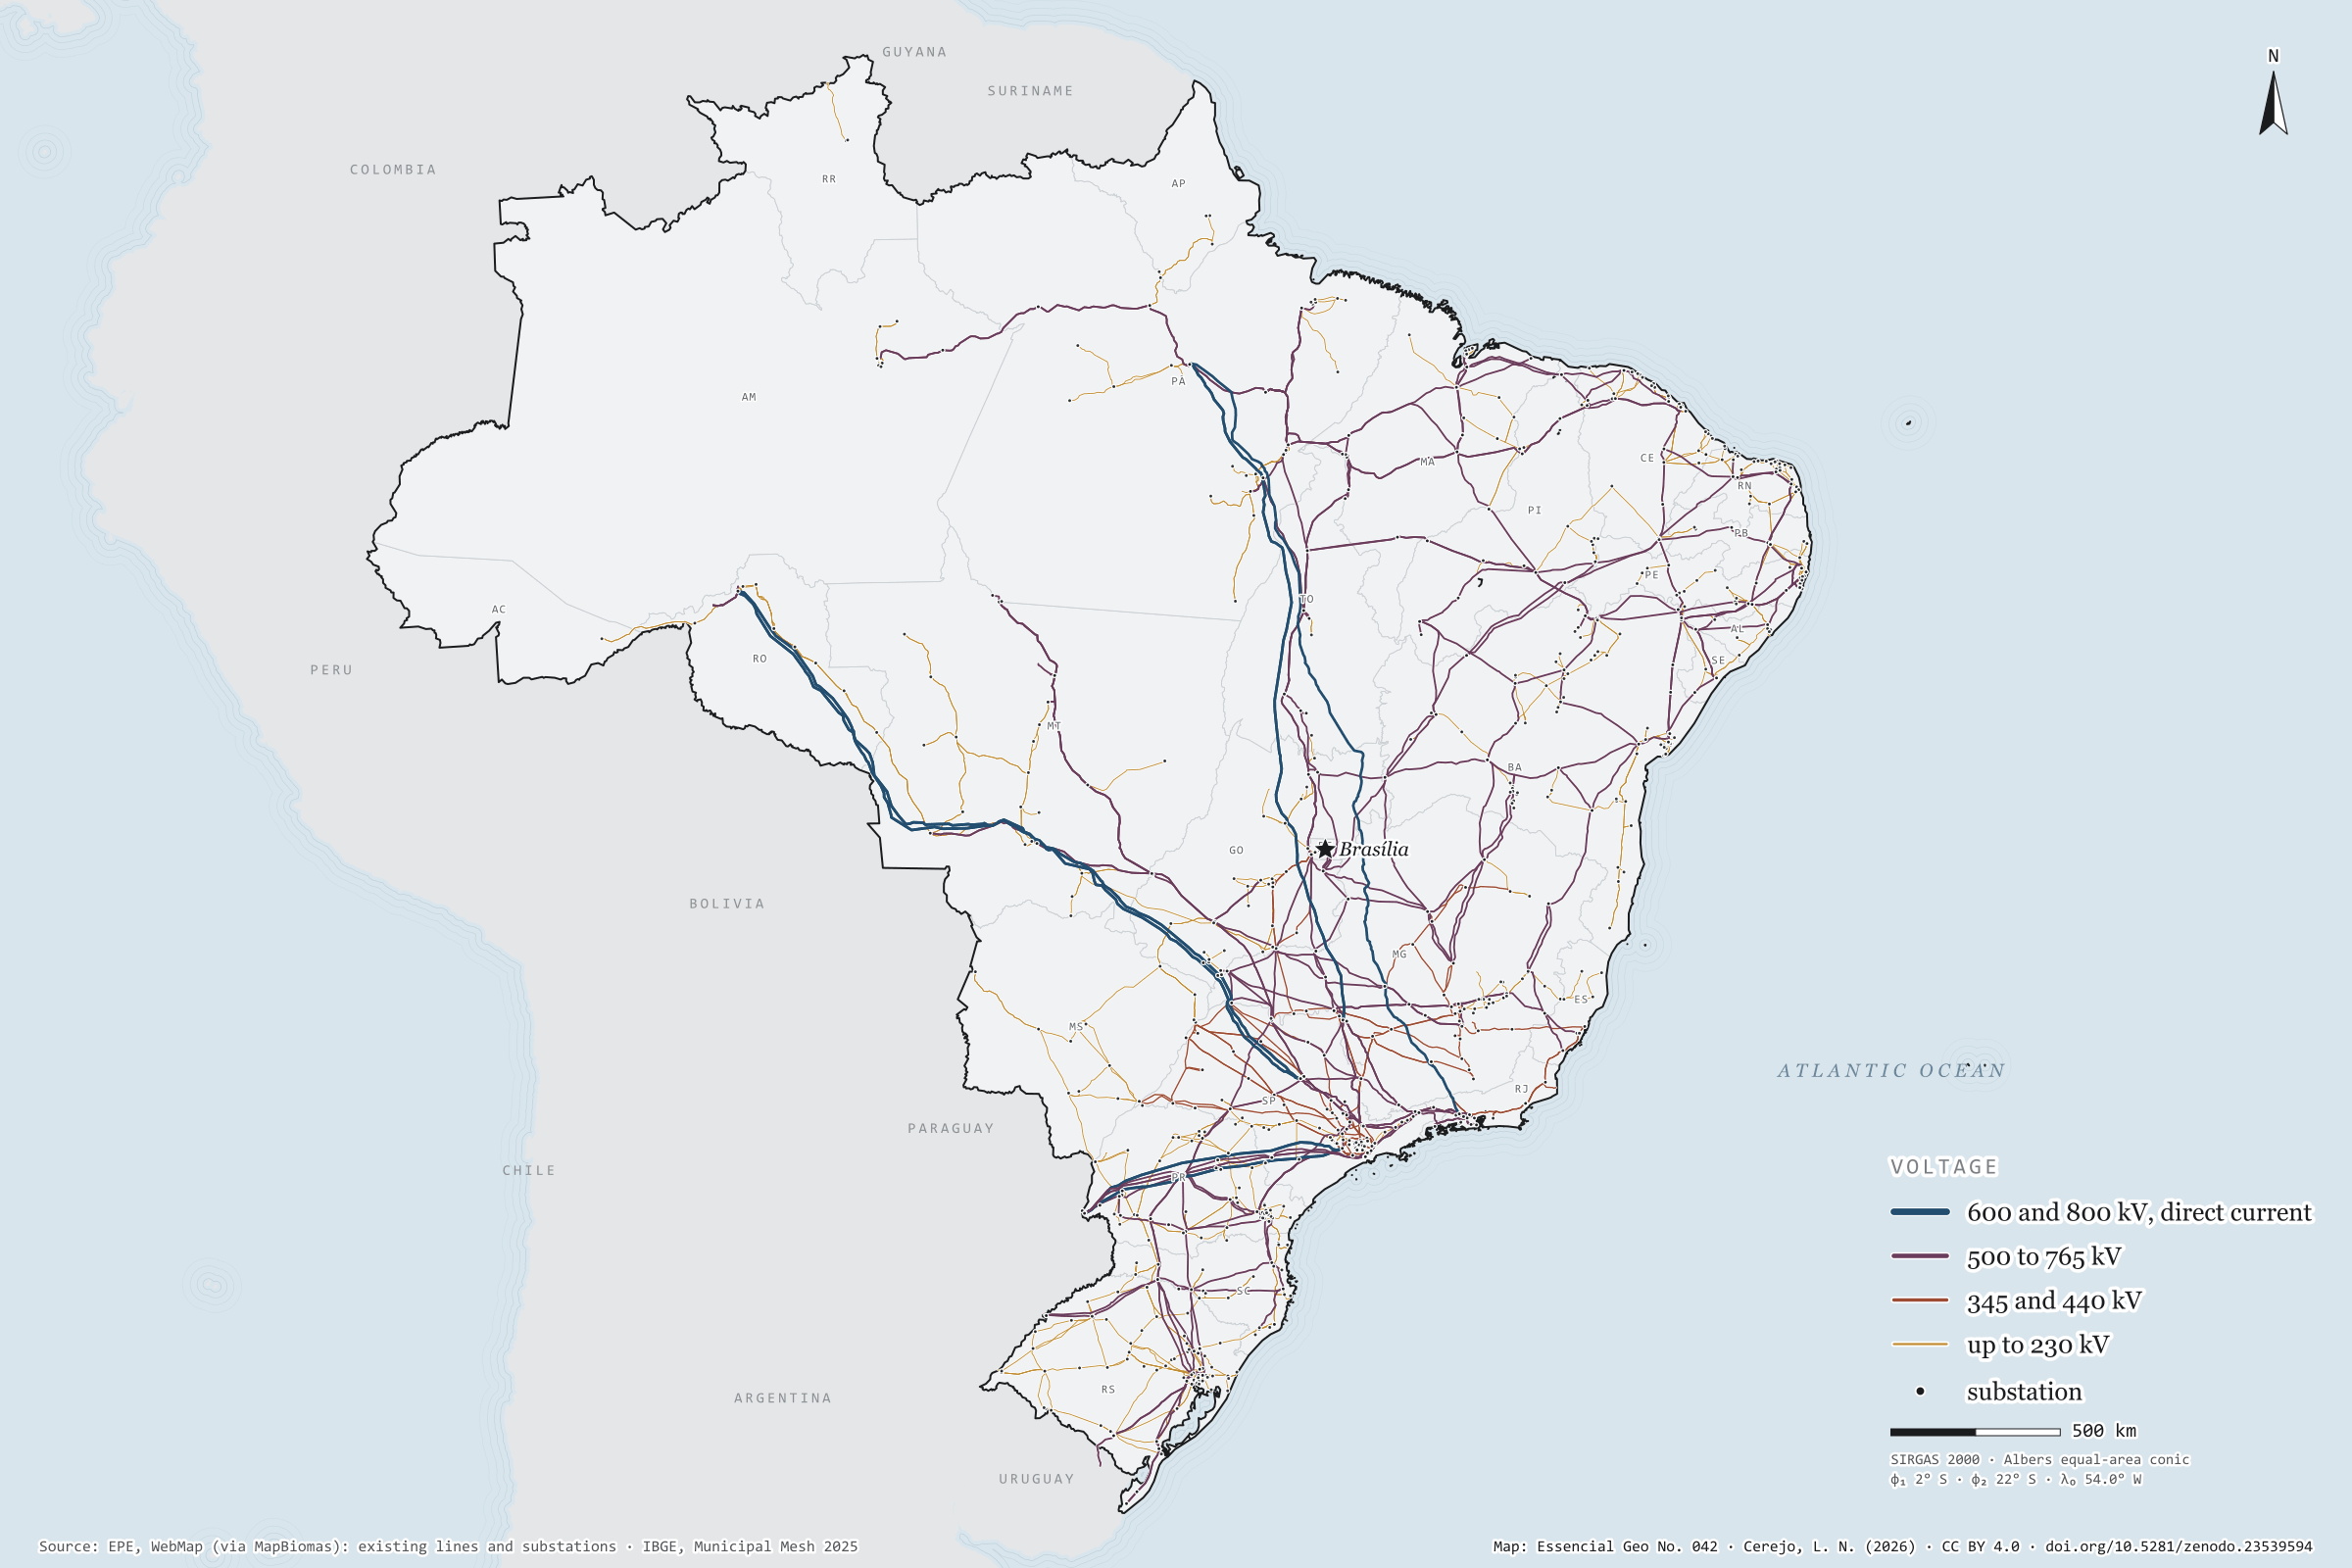
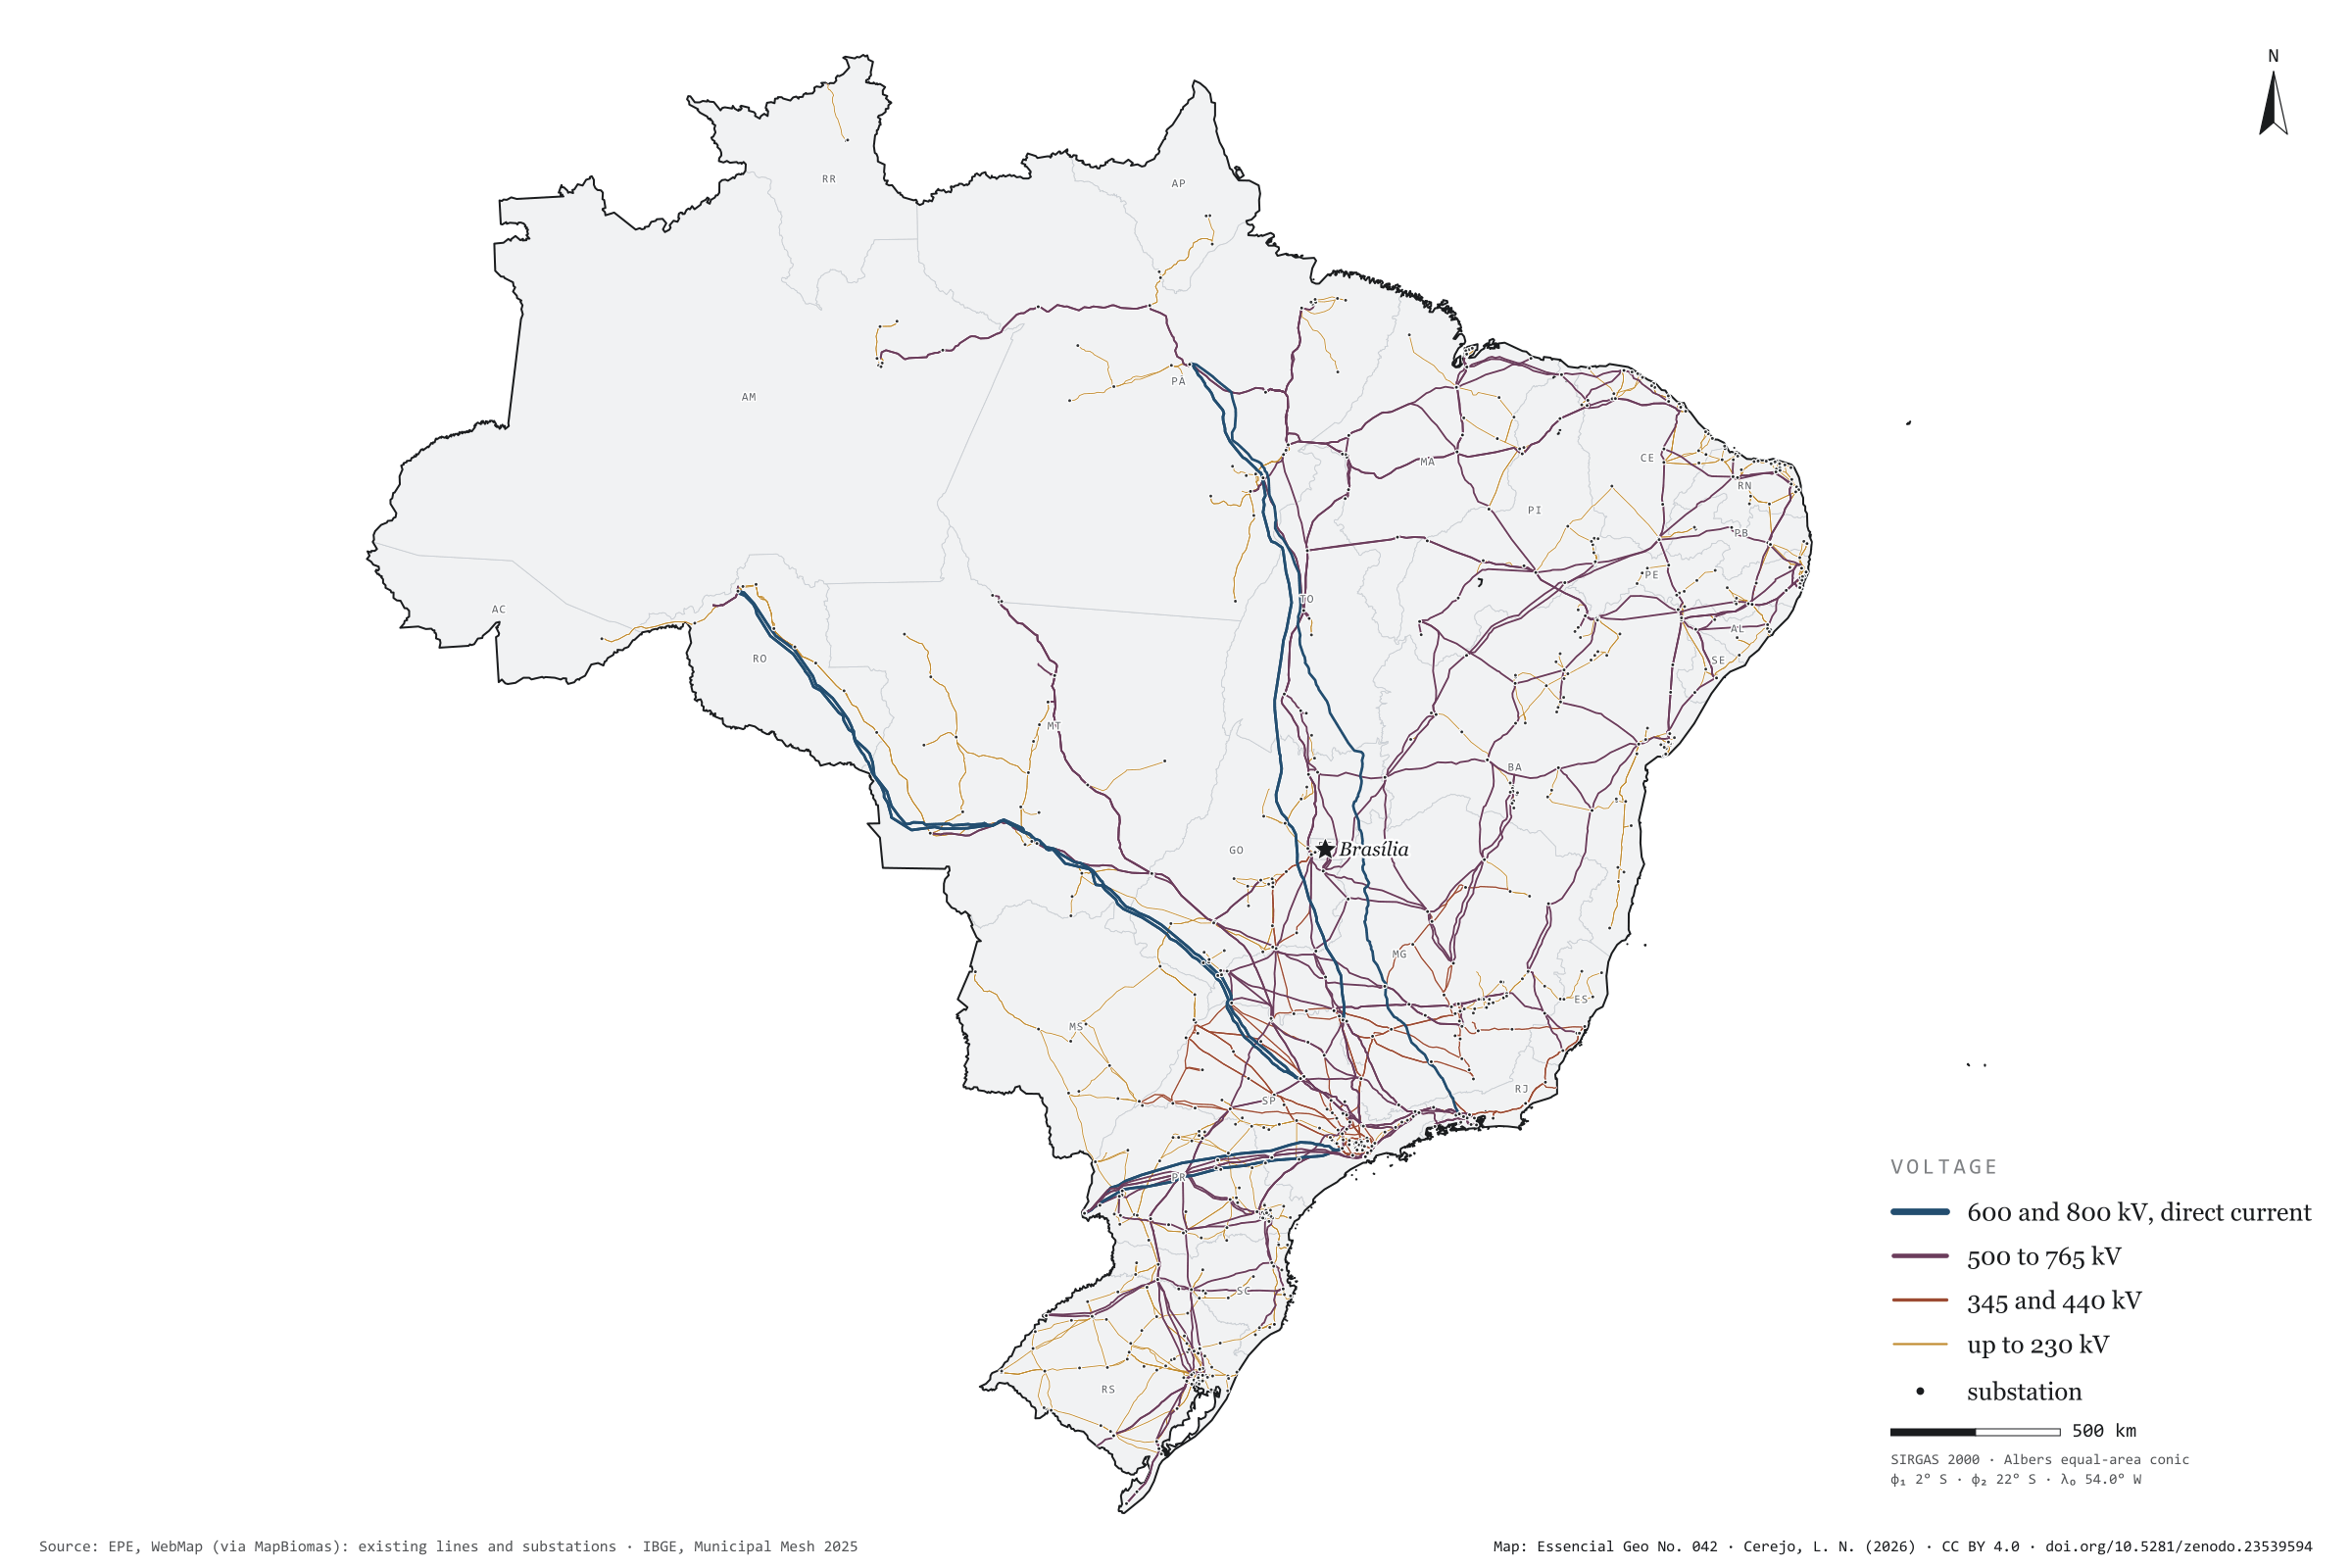
From the Xingu to Rio de Janeiro, an 800 kV direct-current line runs 2,552 km to carry Belo Monte’s power to the South-East: it is the longest of the 1,712 existing transmission lines mapped by EPE. Adding up circuits, they come to 170.2 thousand km of lines and 780 substations. Lines of 500 to 765 kV make up most of the length, 68.0 thousand km; the eleven direct-current lines, 19.5 thousand km, bring the power of Itaipu, the Madeira plants and Belo Monte to the South-East. On the map, the grid thickens in the South-East, the South and along the north-eastern coast, and reaches the Amazon through a handful of wires. First plate of the collection “Electricity in Brazil”.
Technical record · downloads · citation
At a glance
Length by voltage class (thousand km, adding up circuits) (mil km)
até 230 kV66
345 e 440 kV17
500 a 765 kV68
600 e 800 kV, corrente contínua20
The longest line: Xingu – Terminal Rio, 800 kV direct current
2,552km
in service since 2019
Layers
linhas_transmissaoline1,712 lines: voltage, length, year in service, concession holder and voltage class
subestacoespoint780 substations: voltages, year in service, concession holder and state
EPE’s existing transmission lines and substations, grouped into four voltage classes; length as declared by EPE and checked against the geodesic measurement.
The map without a frame, with legend, scale, reference system and credit written on it: ready for papers, lectures and slides. In two versions: with the basemap (neighbours and sea) or only the mapped area, on white.
CEREJO, Lucas Nakamura. Linhas de transmissão: os fios que costuram o país. Versão 1.0.0. [S. l.]: Zenodo, 2026. Conjunto de dados. DOI: 10.5281/zenodo.23539594. Disponível em: https://doi.org/10.5281/zenodo.23539594. Acesso em: 10 nov. 2026.
Cerejo, L. N. (2026). Linhas de transmissão: os fios que costuram o país [Transmission lines: The wires that stitch the country together] (Version 1.0.0) [Data set]. Zenodo. https://doi.org/10.5281/zenodo.23539594
@dataset{cerejo2026_transmissao_brasil,
  author    = {Cerejo, Lucas Nakamura},
  title     = {Linhas de transmissão: Os fios que costuram o país},
  year      = {2026},
  publisher = {Zenodo},
  version   = {1.0.0},
  doi       = {10.5281/zenodo.23539594},
  url       = {https://doi.org/10.5281/zenodo.23539594},
  language  = {portuguese},
  note      = {English title: Transmission lines: The wires that stitch the country together. Licence CC BY 4.0}
}
Fig. 041Central São Paulo state, between Jaú, São Carlos, Piracicaba and Botucatu (SP)EPSG:4674Source: Copernicus DEM GLO-90 (ESA, European Union), digital surface model, 90 m pixels, WWF / HydroSHEDS, IBGE
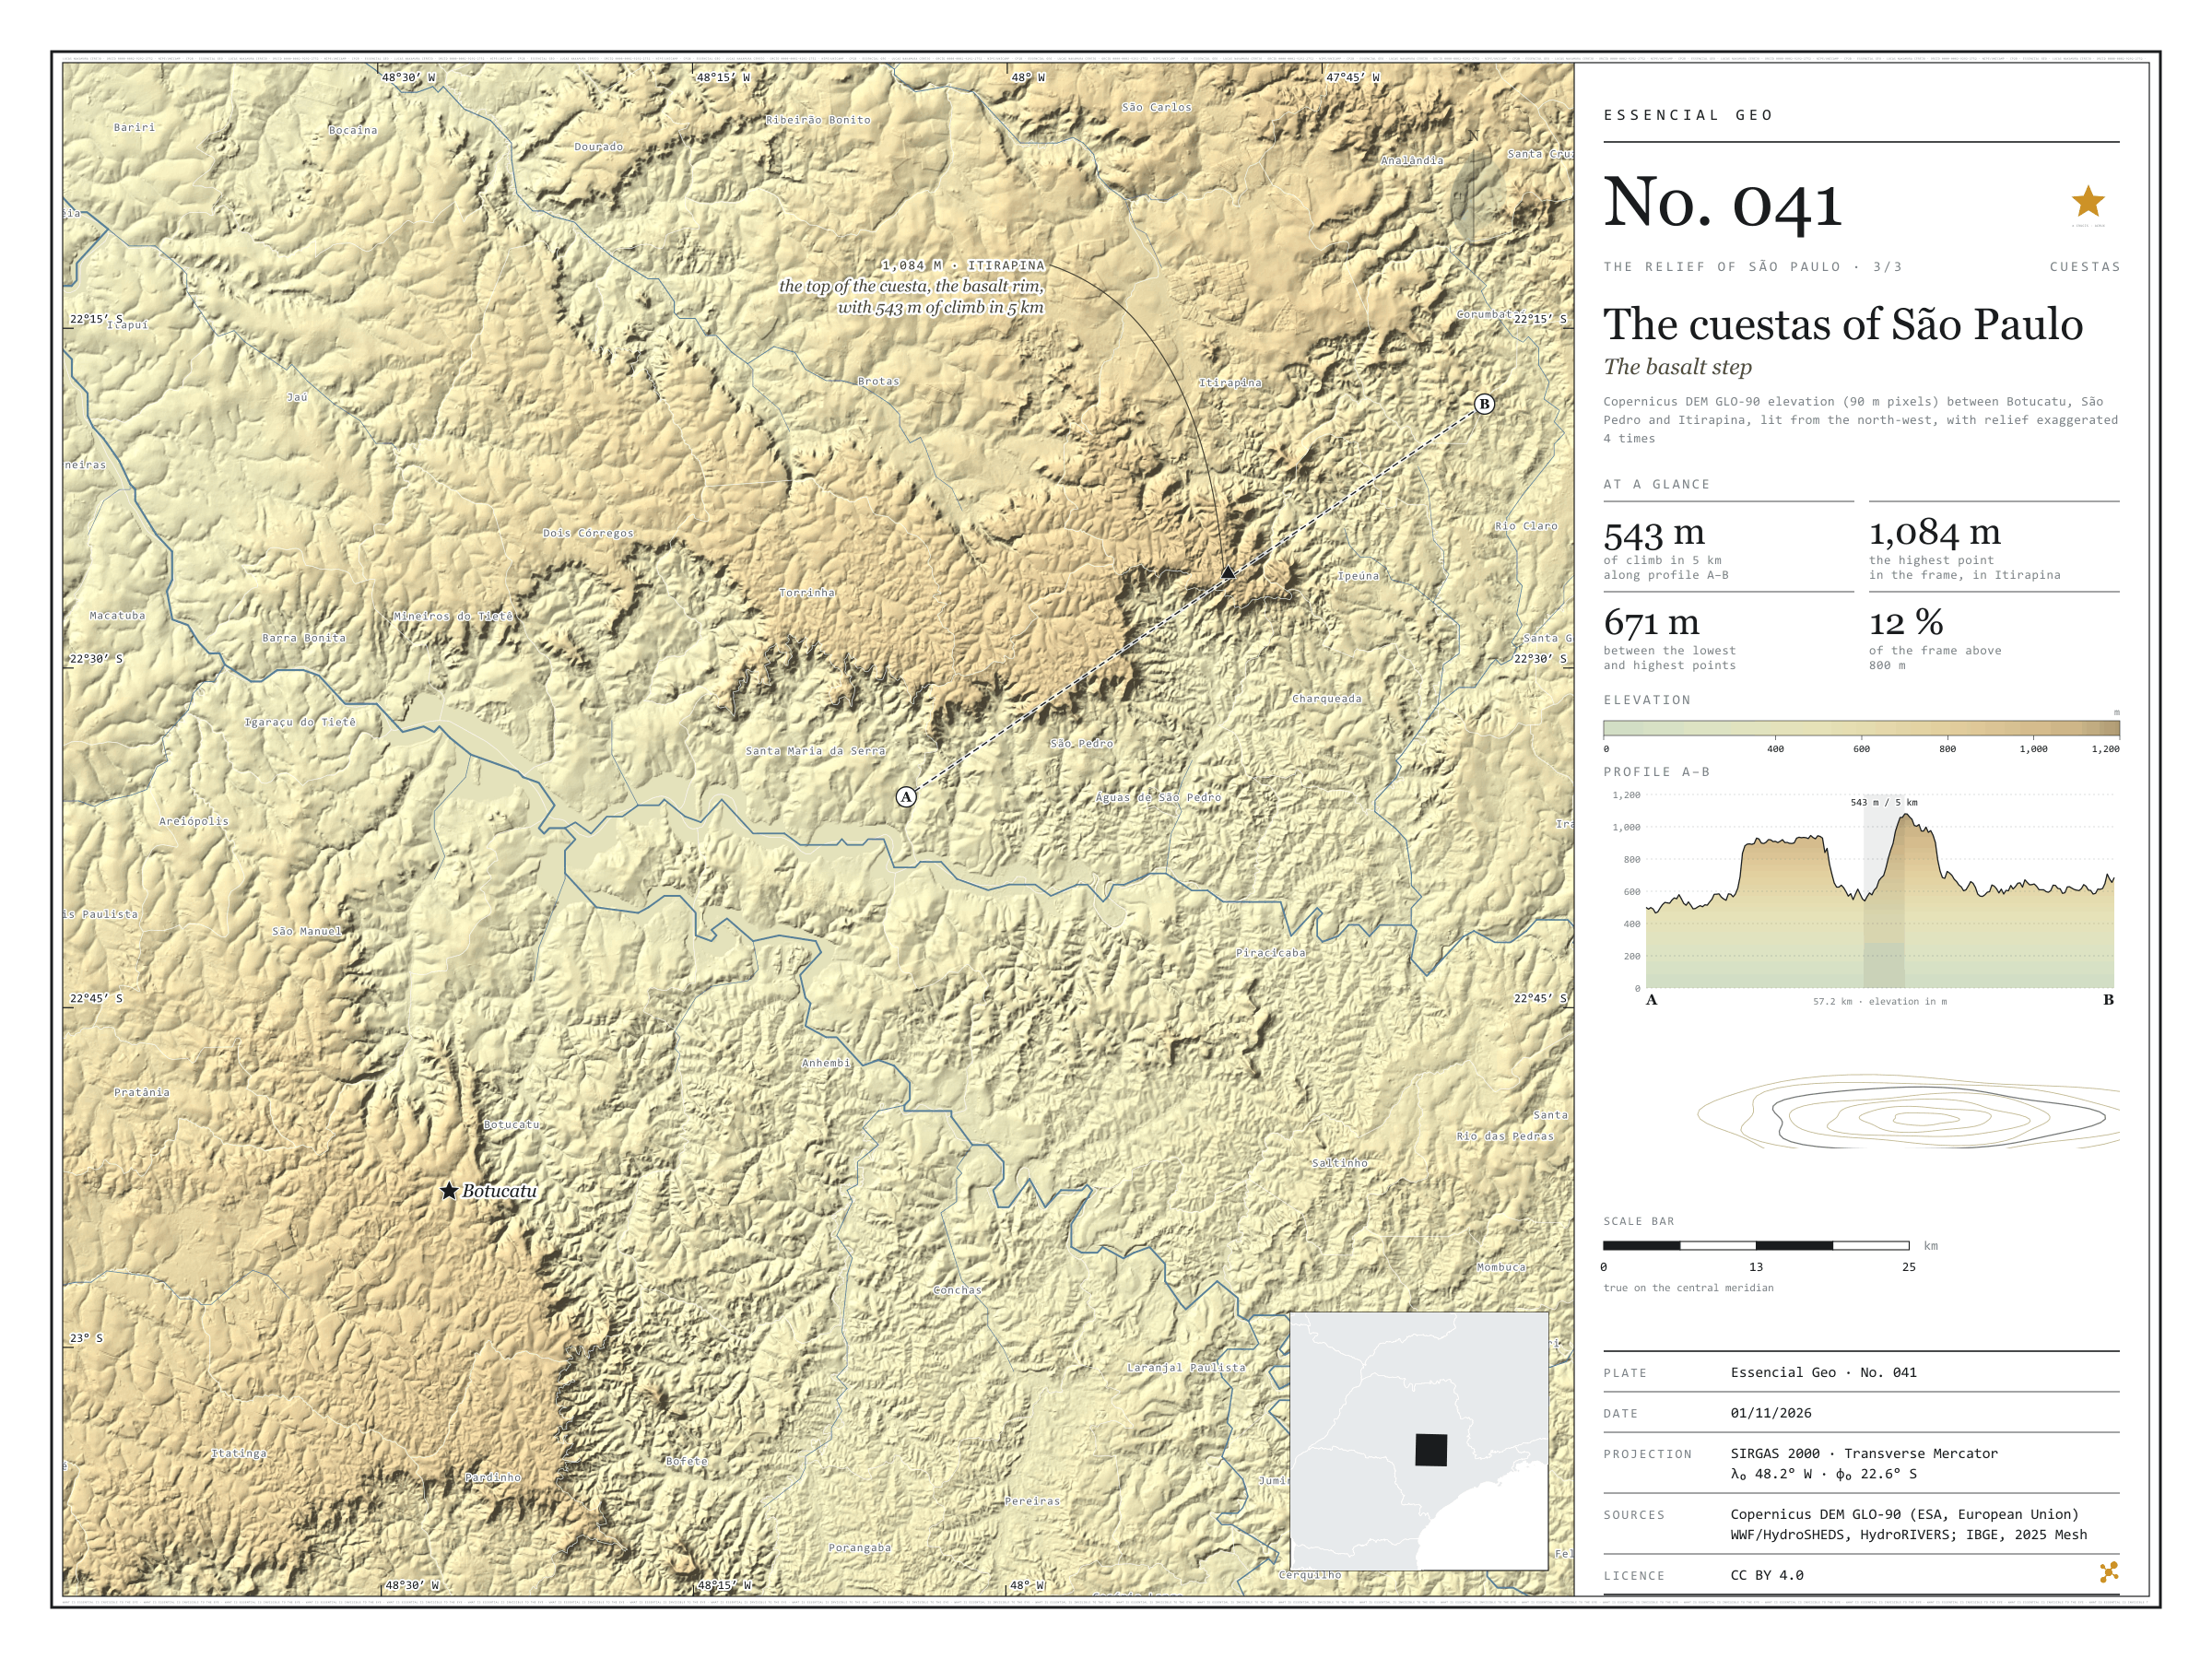
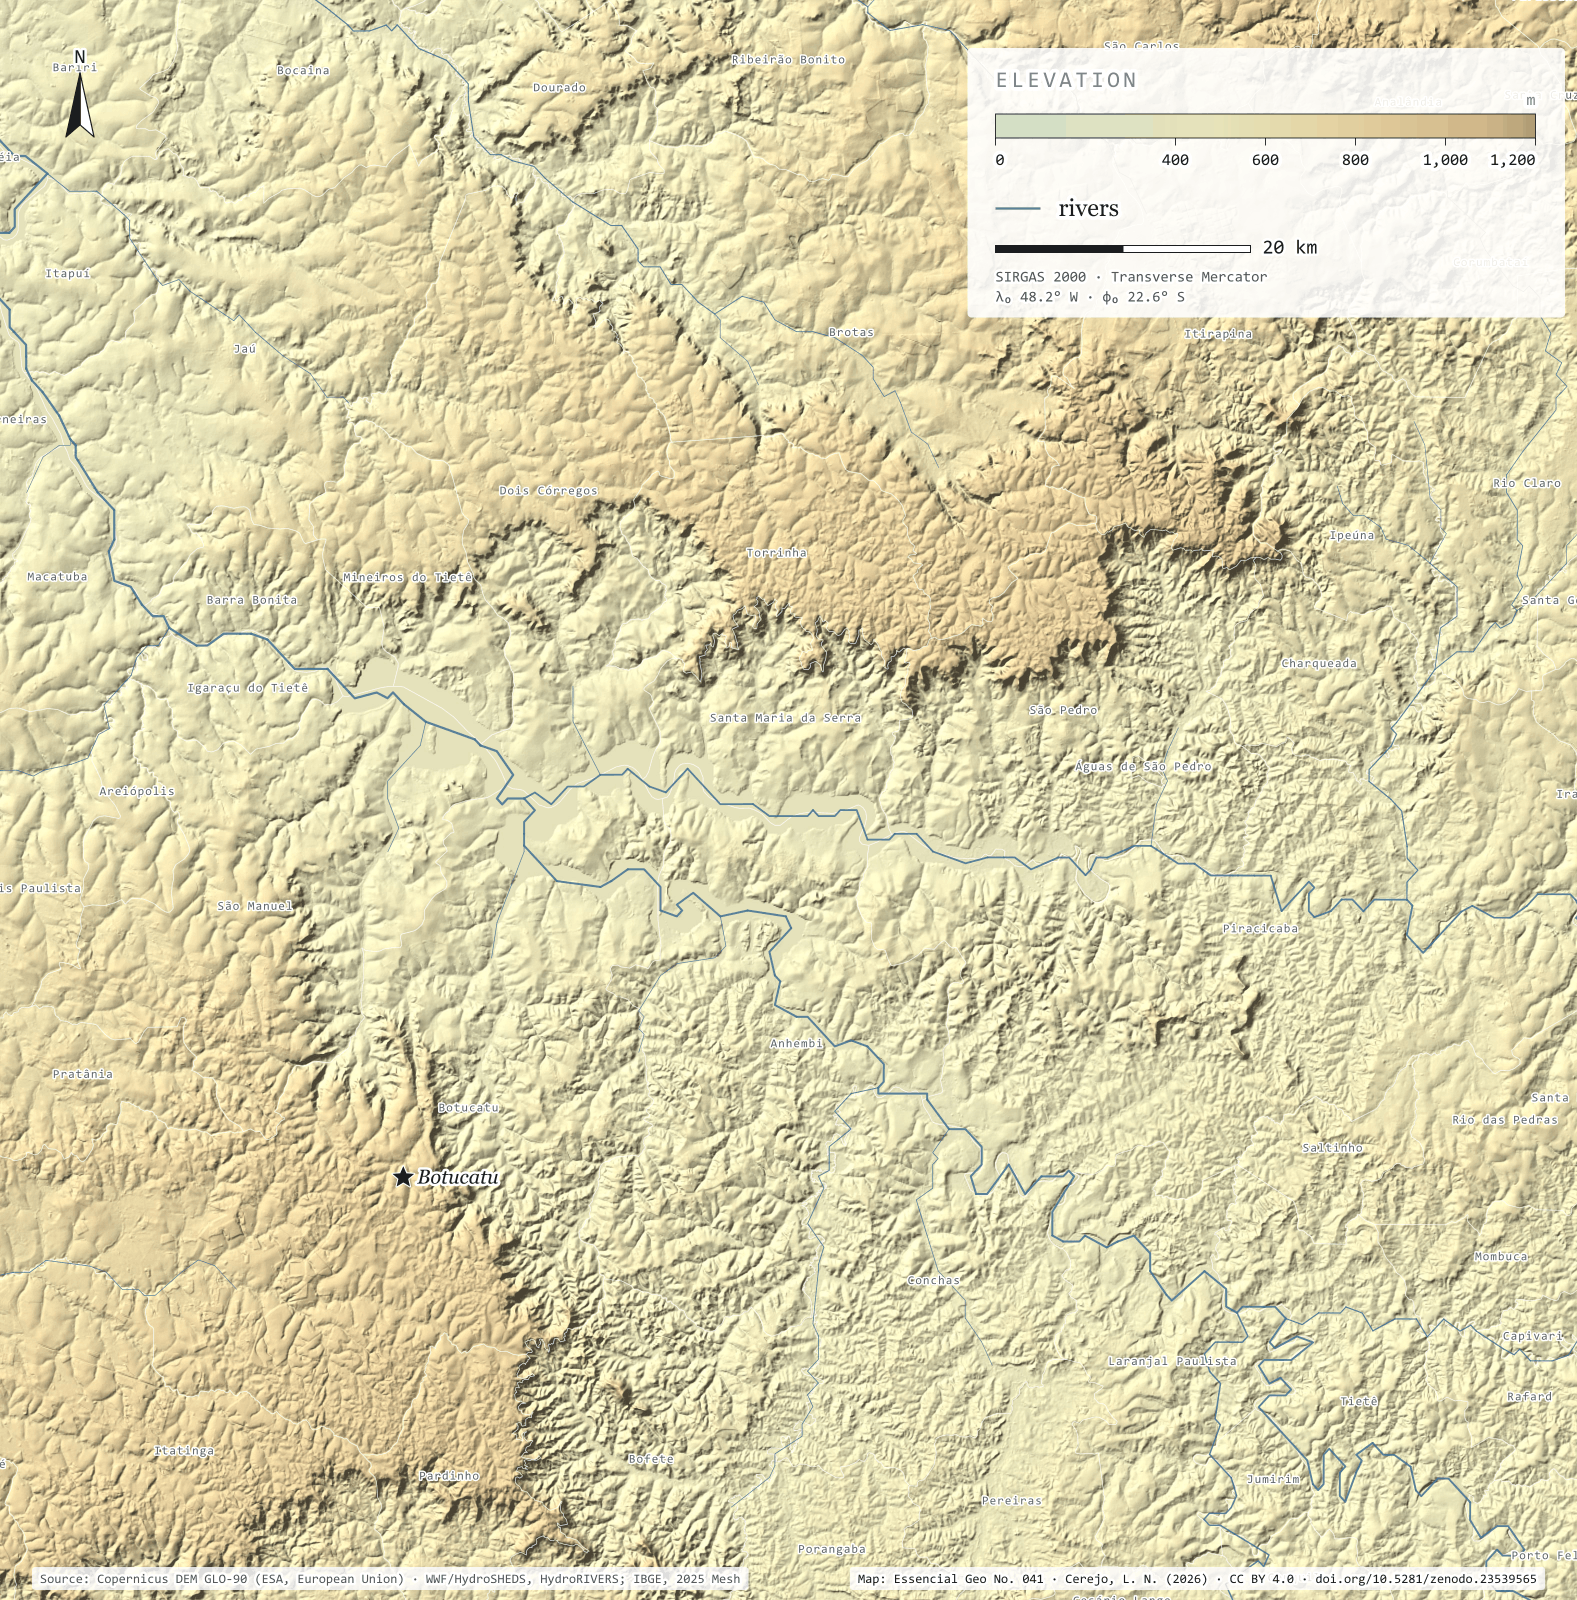
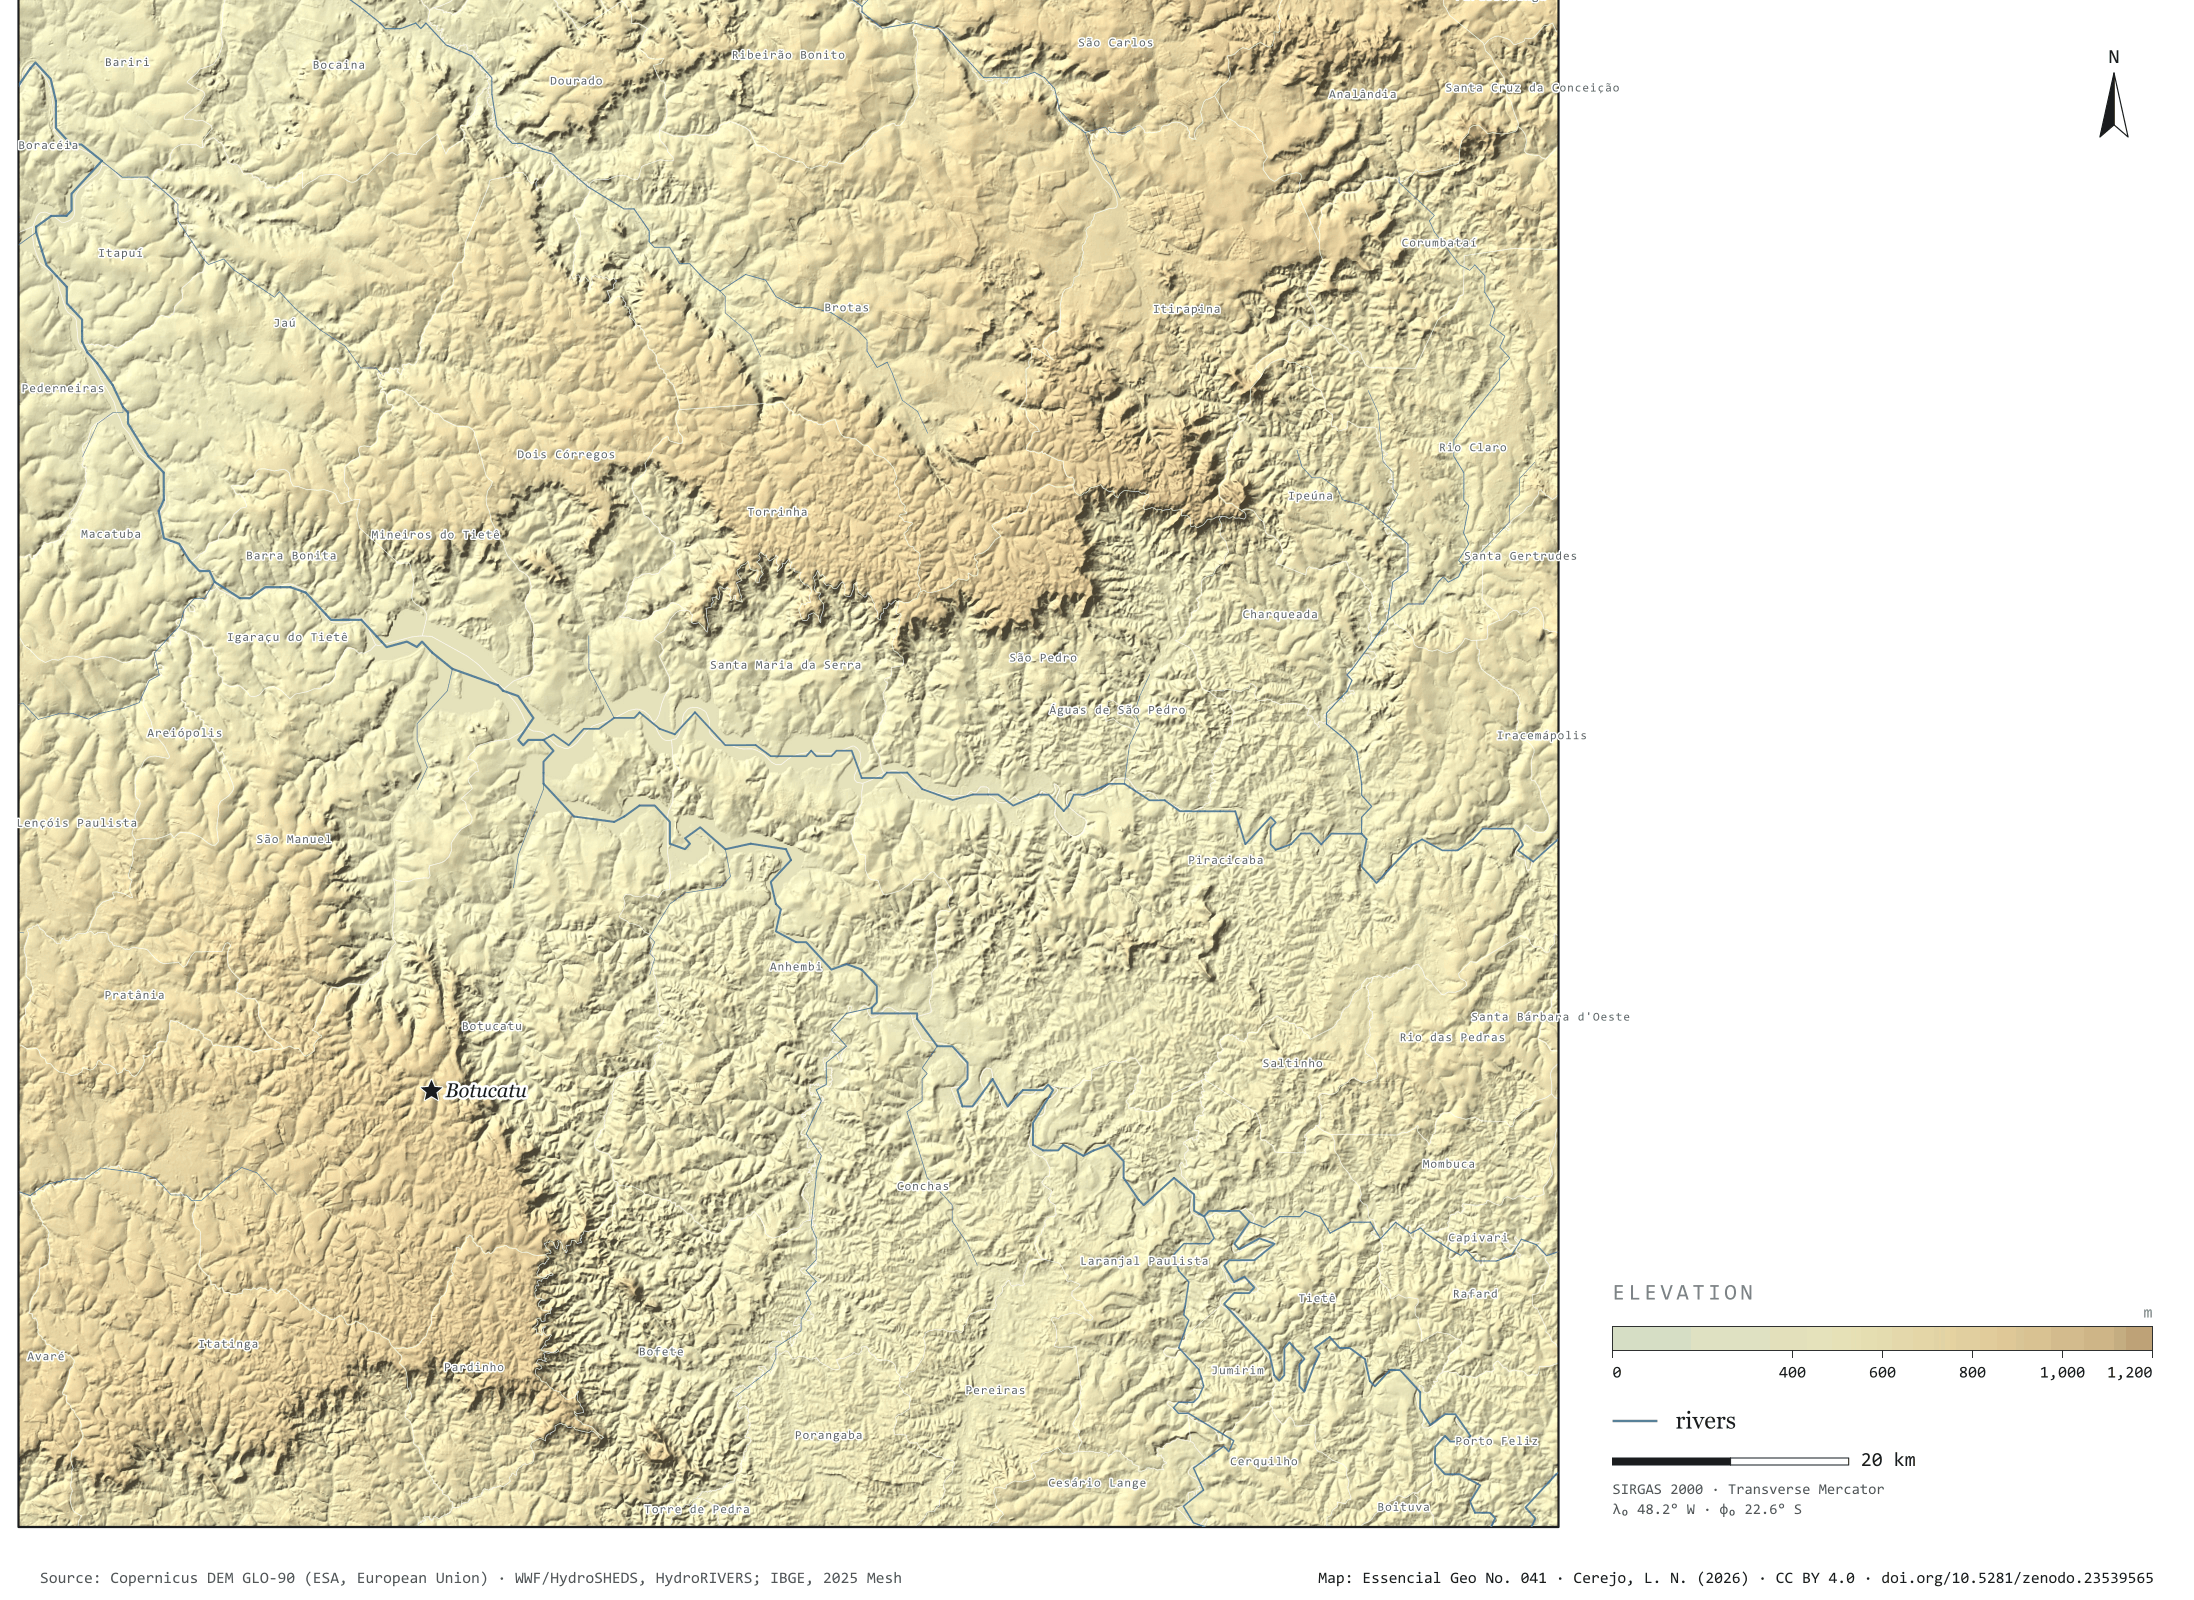
In the middle of the state, the western São Paulo plateau ends in a step: the cuestas, scarps where the layers of basalt and sandstone break off all at once, facing the Peripheral Depression. Profile A–B leaves the depression near São Pedro, at 500 m, rises to a first plateau at 956 m, dips into a valley at 537 m and climbs the Itirapina cuesta: 543 m of climb in 5 km, up to 1,081 m. On the far side, the ground falls to the Corumbataí valley, at around 640 m. The highest point in the frame, 1,084 m, is right there, in Itirapina; between it and the lowest point lie 671 m. In the south-west, the Botucatu cuesta draws the same step. In the 15,399 km² frame, only 12.3% of the ground lies above 800 m. Third plate of the collection “The relief of São Paulo”.
Technical record · downloads · citation
At a glance
Largest climb in 5 km along profile A–B
543m
On the Itirapina cuesta
Difference between the highest and lowest points in the frame
671m
Area of the frame by elevation band (km²)
400–500 m2,628
500–6006,015
600–7002,643
700–8002,224
800–9001,540
900–1.000327
1.000–1.10022
Layers
relevorasterGeoTIFF of elevation in metres (90 m pixels) clipped to the frame, with the plate’s hypsometric ramp in a .qml style
faixas_altitudepolygon7 elevation bands, every 100 m, with the area of each
perfillineThe A–B profile line, 57.2 km
ponto_mais_altopointHighest point in the frame, 1,084 m, in Itirapina
municipiospolygonThe 58 municipalities in the frame
Copernicus DEM GLO-90 tiles mosaicked, lit from the north-west with relief exaggerated 4 times and coloured by elevation band; profile A–B sampled at 600 points, drawn through the frame’s steepest local relief.
The map without a frame, with legend, scale, reference system and credit written on it: ready for papers, lectures and slides. In two versions: with the basemap (neighbours and sea) or only the mapped area, on white.
CEREJO, Lucas Nakamura. Cuestas paulistas: o degrau do basalto. Versão 1.0.0. [S. l.]: Zenodo, 2026. Conjunto de dados. DOI: 10.5281/zenodo.23539565. Disponível em: https://doi.org/10.5281/zenodo.23539565. Acesso em: 10 nov. 2026.
Cerejo, L. N. (2026). Cuestas paulistas: o degrau do basalto [The cuestas of São Paulo: The basalt step] (Version 1.0.0) [Data set]. Zenodo. https://doi.org/10.5281/zenodo.23539565
@dataset{cerejo2026_cuestas_paulistas,
  author    = {Cerejo, Lucas Nakamura},
  title     = {Cuestas paulistas: O degrau do basalto},
  year      = {2026},
  publisher = {Zenodo},
  version   = {1.0.0},
  doi       = {10.5281/zenodo.23539565},
  url       = {https://doi.org/10.5281/zenodo.23539565},
  language  = {portuguese},
  note      = {English title: The cuestas of São Paulo: The basalt step. Licence CC BY 4.0}
}
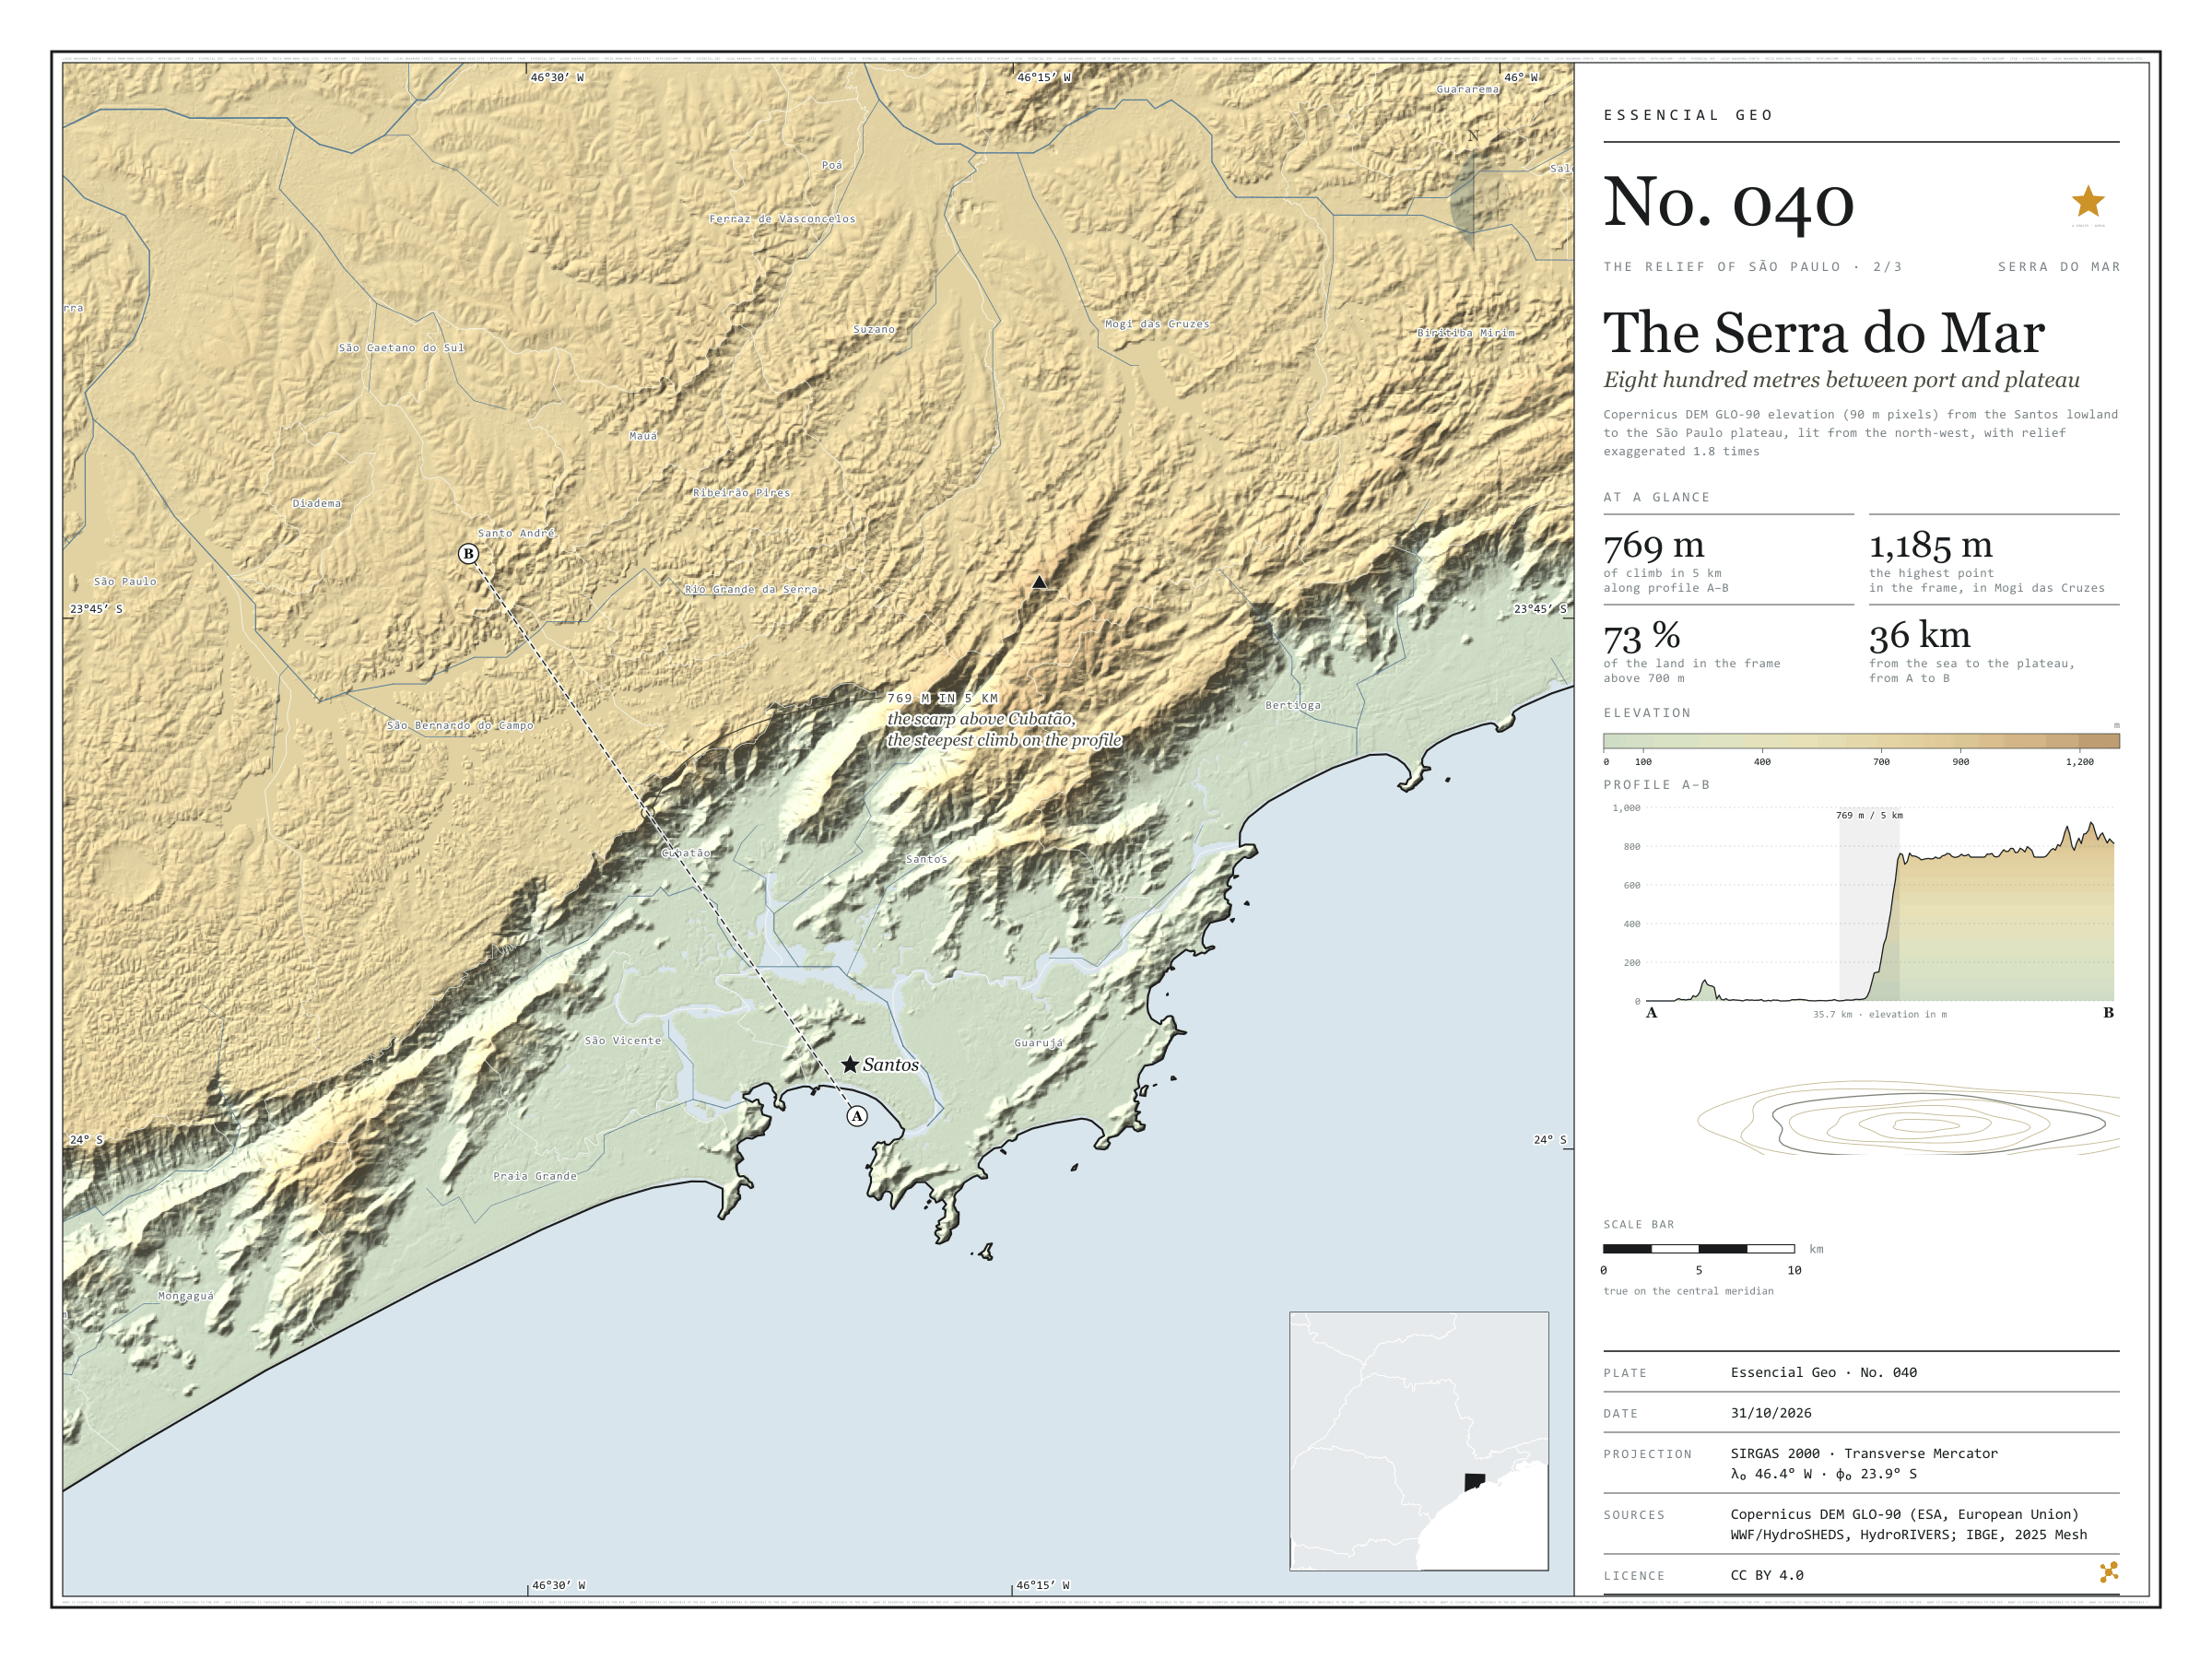
Fig. 040Santos lowland, Serra do Mar and São Paulo plateau, between Mongaguá, Bertioga and São Paulo (SP)EPSG:4674Source: Copernicus DEM GLO-90 (ESA, European Union), digital surface model, 90 m pixels, WWF / HydroSHEDS, IBGE
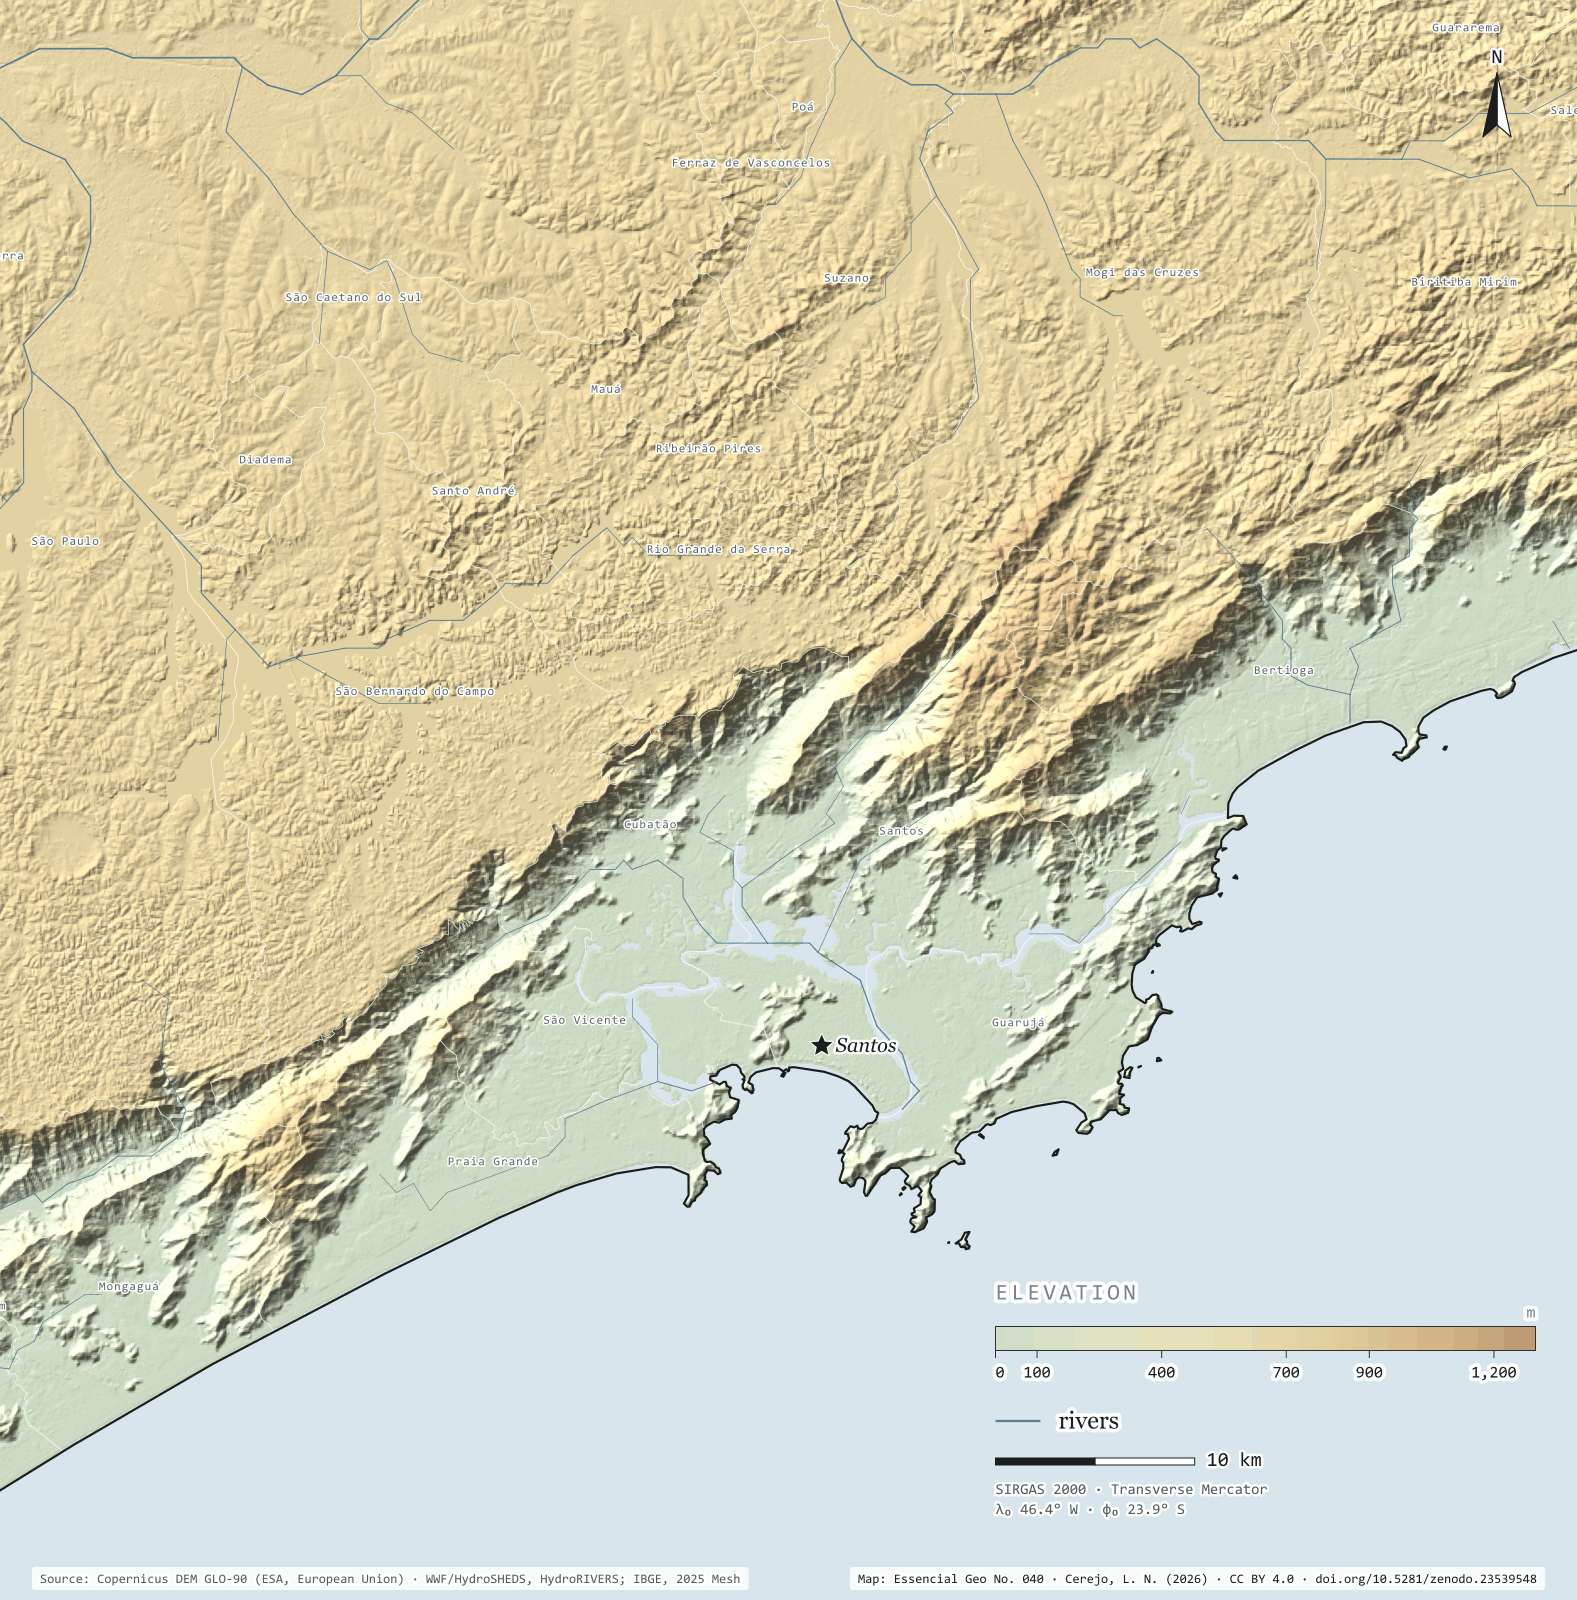
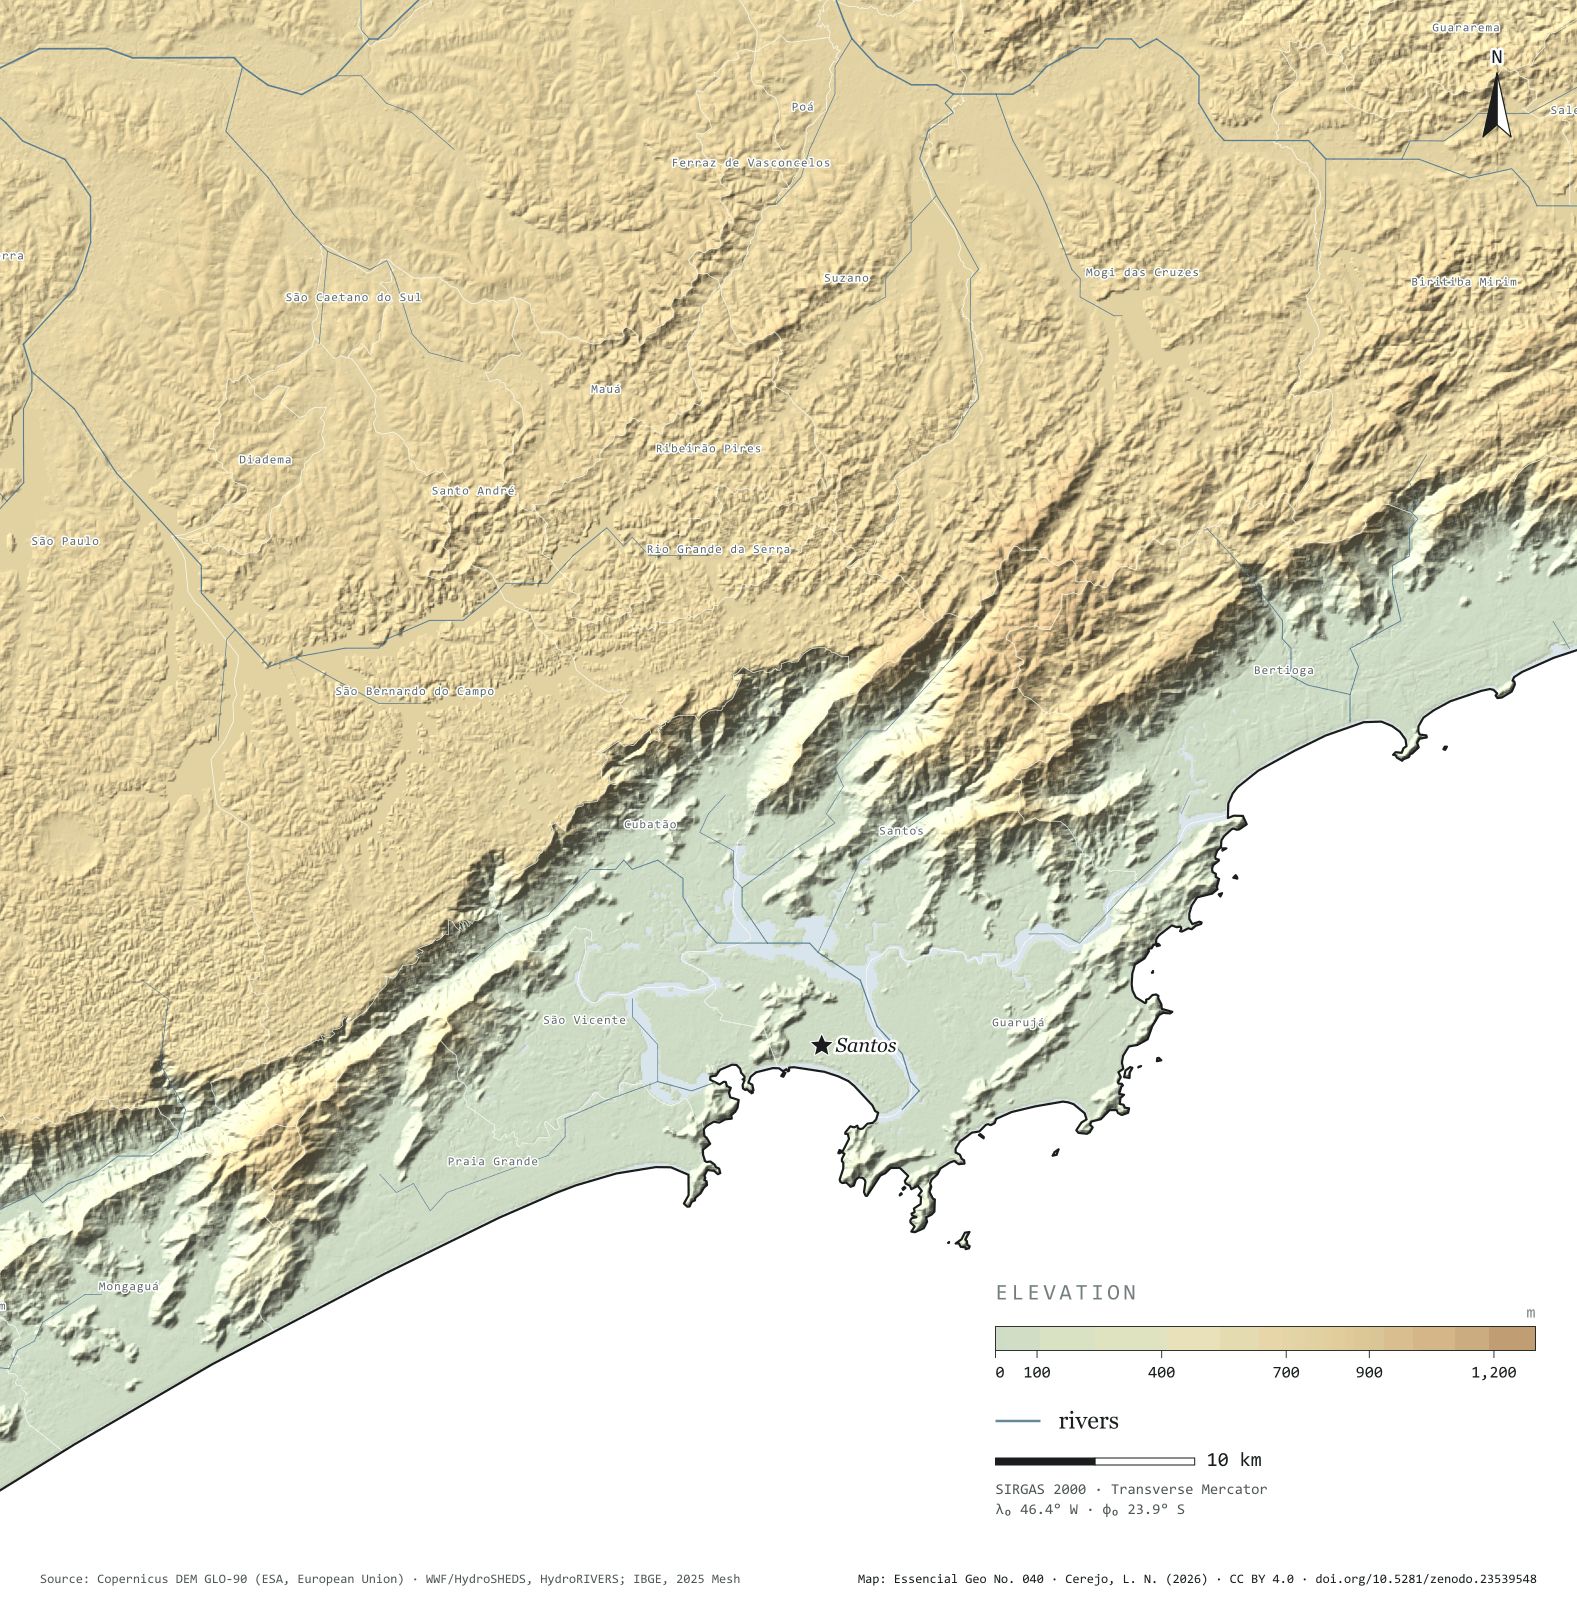
Profile A–B leaves the beach at Santos and runs 15 km across the lowland, between the mangroves and the port; apart from a 109 m hill right at the start, it stays a few metres above sea level. Then the Serra do Mar rises over Cubatão: 769 m of climb in 5 km, and at the top begins the plateau, which rolls on at around 760 m to São Bernardo do Campo and São Paulo. The whole slope, from 20 to 700 m, takes up only 596 km² in the frame’s elevation bands, 14% of the land; 72.5% of the ground lies above 700 m. The Anchieta and Imigrantes motorways and the railway climb this wall, and the Billings reservoir’s water is pumped down it to Cubatão. The highest point in the frame, 1,185 m, is in Mogi das Cruzes. Second plate of the collection “The relief of São Paulo”.
Technical record · downloads · citation
At a glance
Largest climb in 5 km along profile A–B
769m
On the scarp above Cubatão, inside São Bernardo do Campo
Land in the frame above 700 m
73%
Land area of the frame by elevation band (km²)
0–20 m598
20–100154
100–200133
200–400152
400–600107
600–70050
700–8002,310
800–900662
900–1.00087
1.000–1.20032
Layers
relevorasterGeoTIFF of elevation in metres (90 m pixels) clipped to the frame, with the plate’s hypsometric ramp in a .qml style
faixas_altitudepolygon10 elevation bands, finer near the sea, with the area of each
perfillineThe A–B profile line, 35.7 km
ponto_mais_altopointHighest point in the frame, 1,185 m, in Mogi das Cruzes
municipiospolygonThe 25 São Paulo municipalities in the frame
Copernicus DEM GLO-90 tiles mosaicked, lit from the north-west with relief exaggerated 1.8 times and coloured by elevation band; profile A–B sampled at 600 points.
The map without a frame, with legend, scale, reference system and credit written on it: ready for papers, lectures and slides. In two versions: with the basemap (neighbours and sea) or only the mapped area, on white.
CEREJO, Lucas Nakamura. Serra do Mar: oitocentos metros entre o porto e o planalto. Versão 1.0.0. [S. l.]: Zenodo, 2026. Conjunto de dados. DOI: 10.5281/zenodo.23539548. Disponível em: https://doi.org/10.5281/zenodo.23539548. Acesso em: 10 nov. 2026.
Cerejo, L. N. (2026). Serra do Mar: oitocentos metros entre o porto e o planalto [The Serra do Mar: Eight hundred metres between port and plateau] (Version 1.0.0) [Data set]. Zenodo. https://doi.org/10.5281/zenodo.23539548
@dataset{cerejo2026_serra_do_mar,
  author    = {Cerejo, Lucas Nakamura},
  title     = {Serra do Mar: Oitocentos metros entre o porto e o planalto},
  year      = {2026},
  publisher = {Zenodo},
  version   = {1.0.0},
  doi       = {10.5281/zenodo.23539548},
  url       = {https://doi.org/10.5281/zenodo.23539548},
  language  = {portuguese},
  note      = {English title: The Serra do Mar: Eight hundred metres between port and plateau. Licence CC BY 4.0}
}
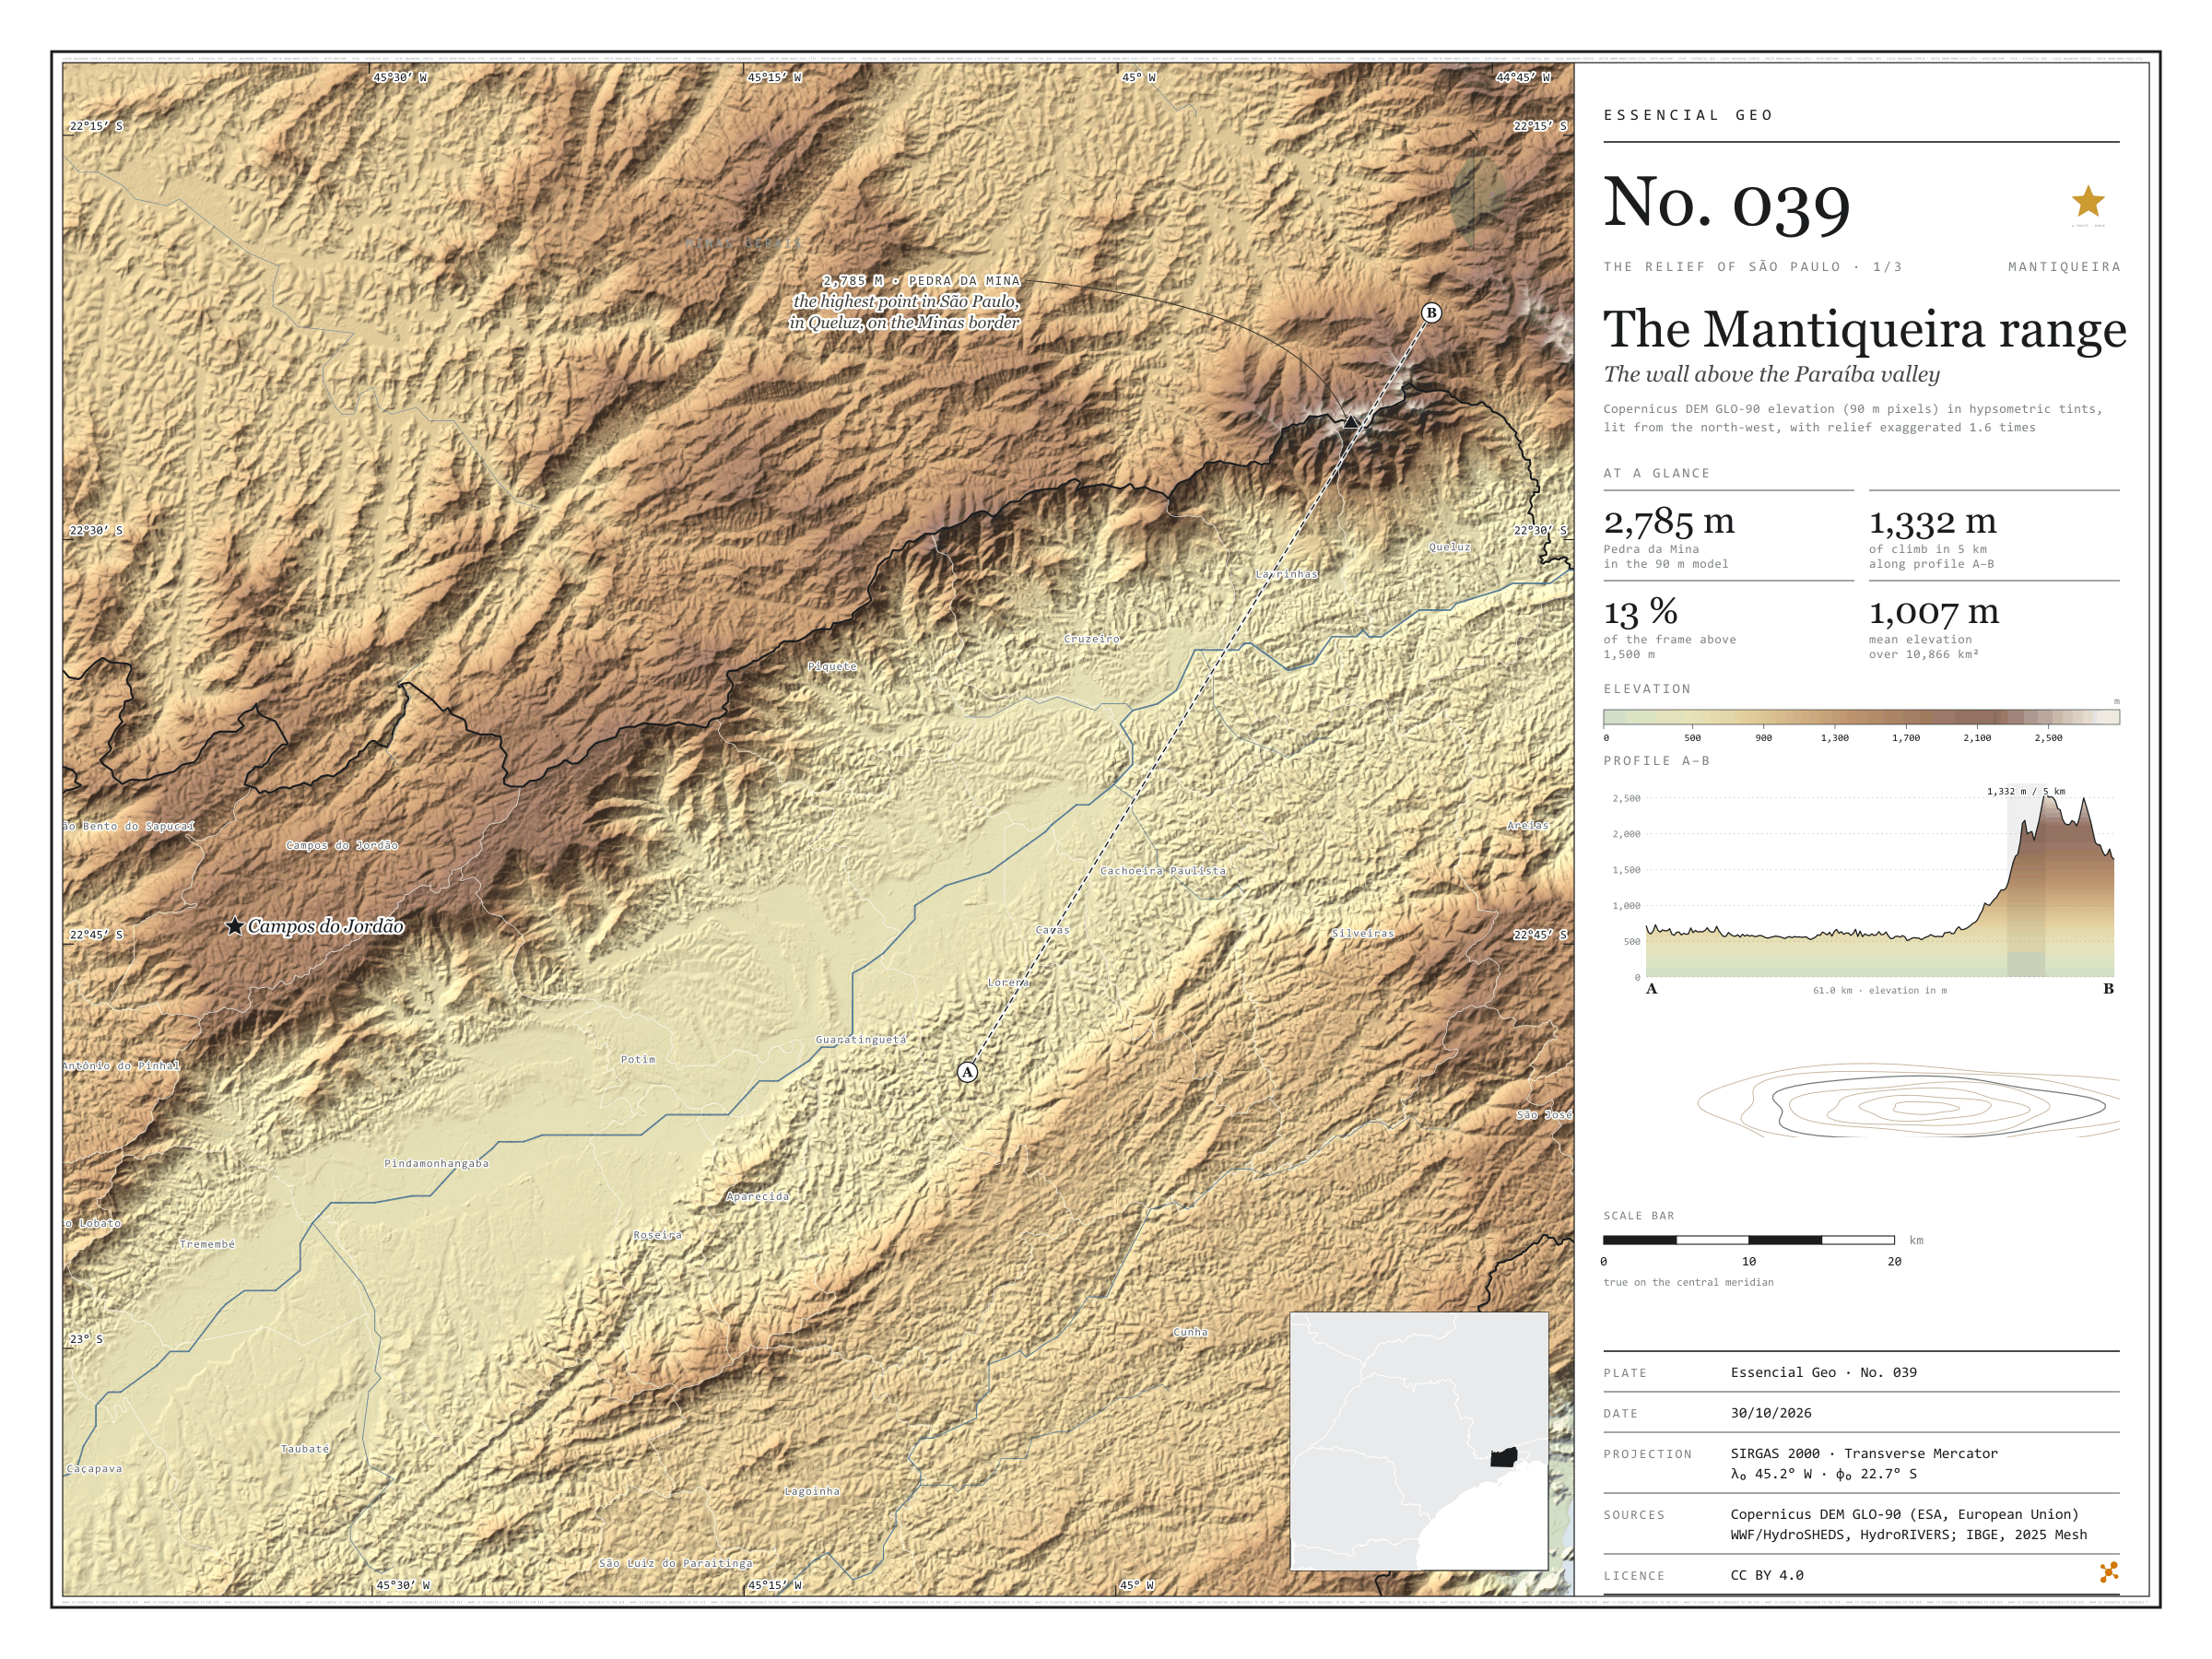
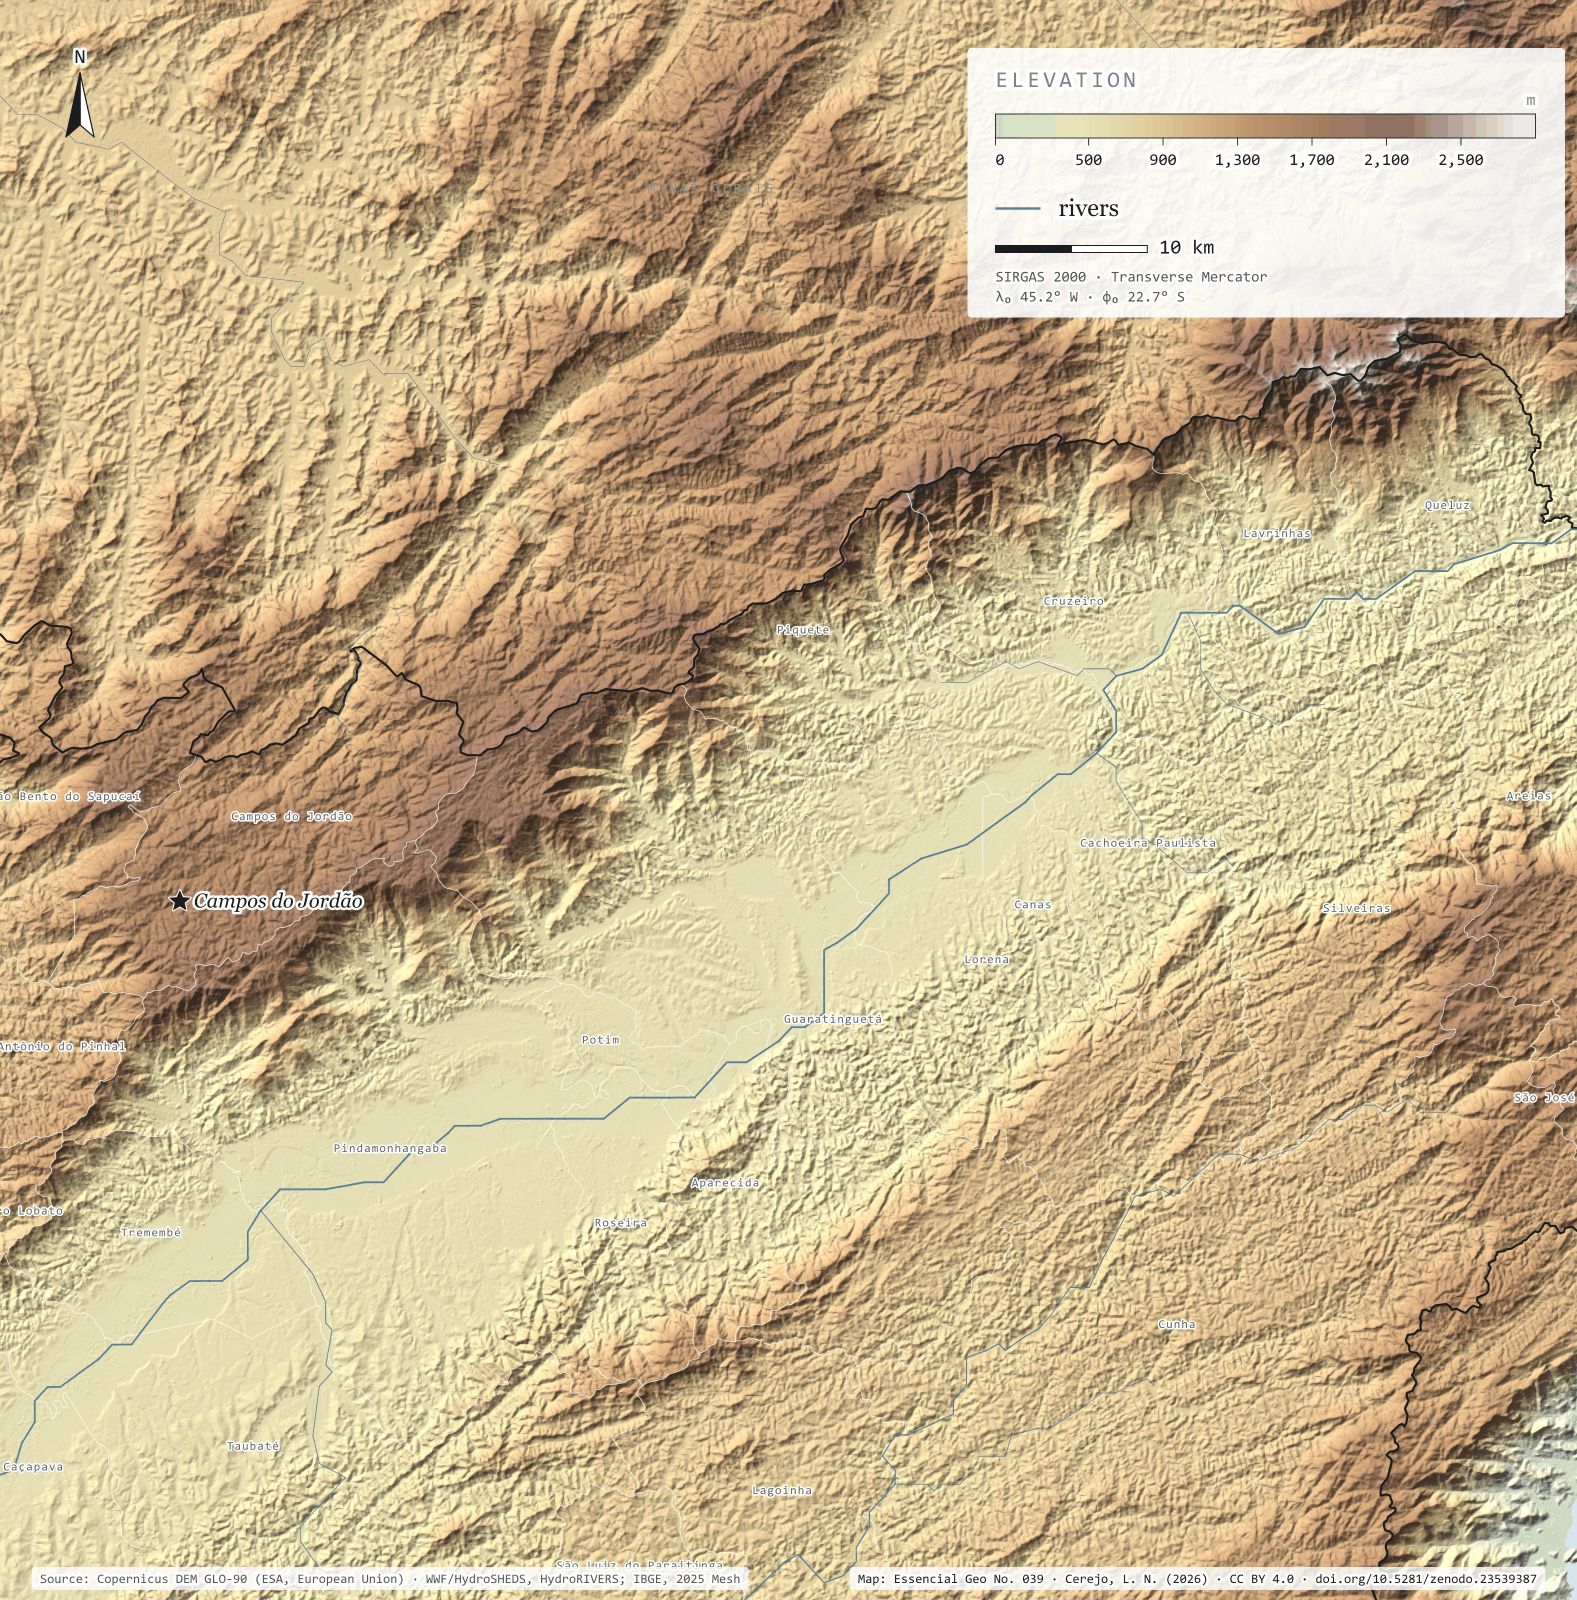
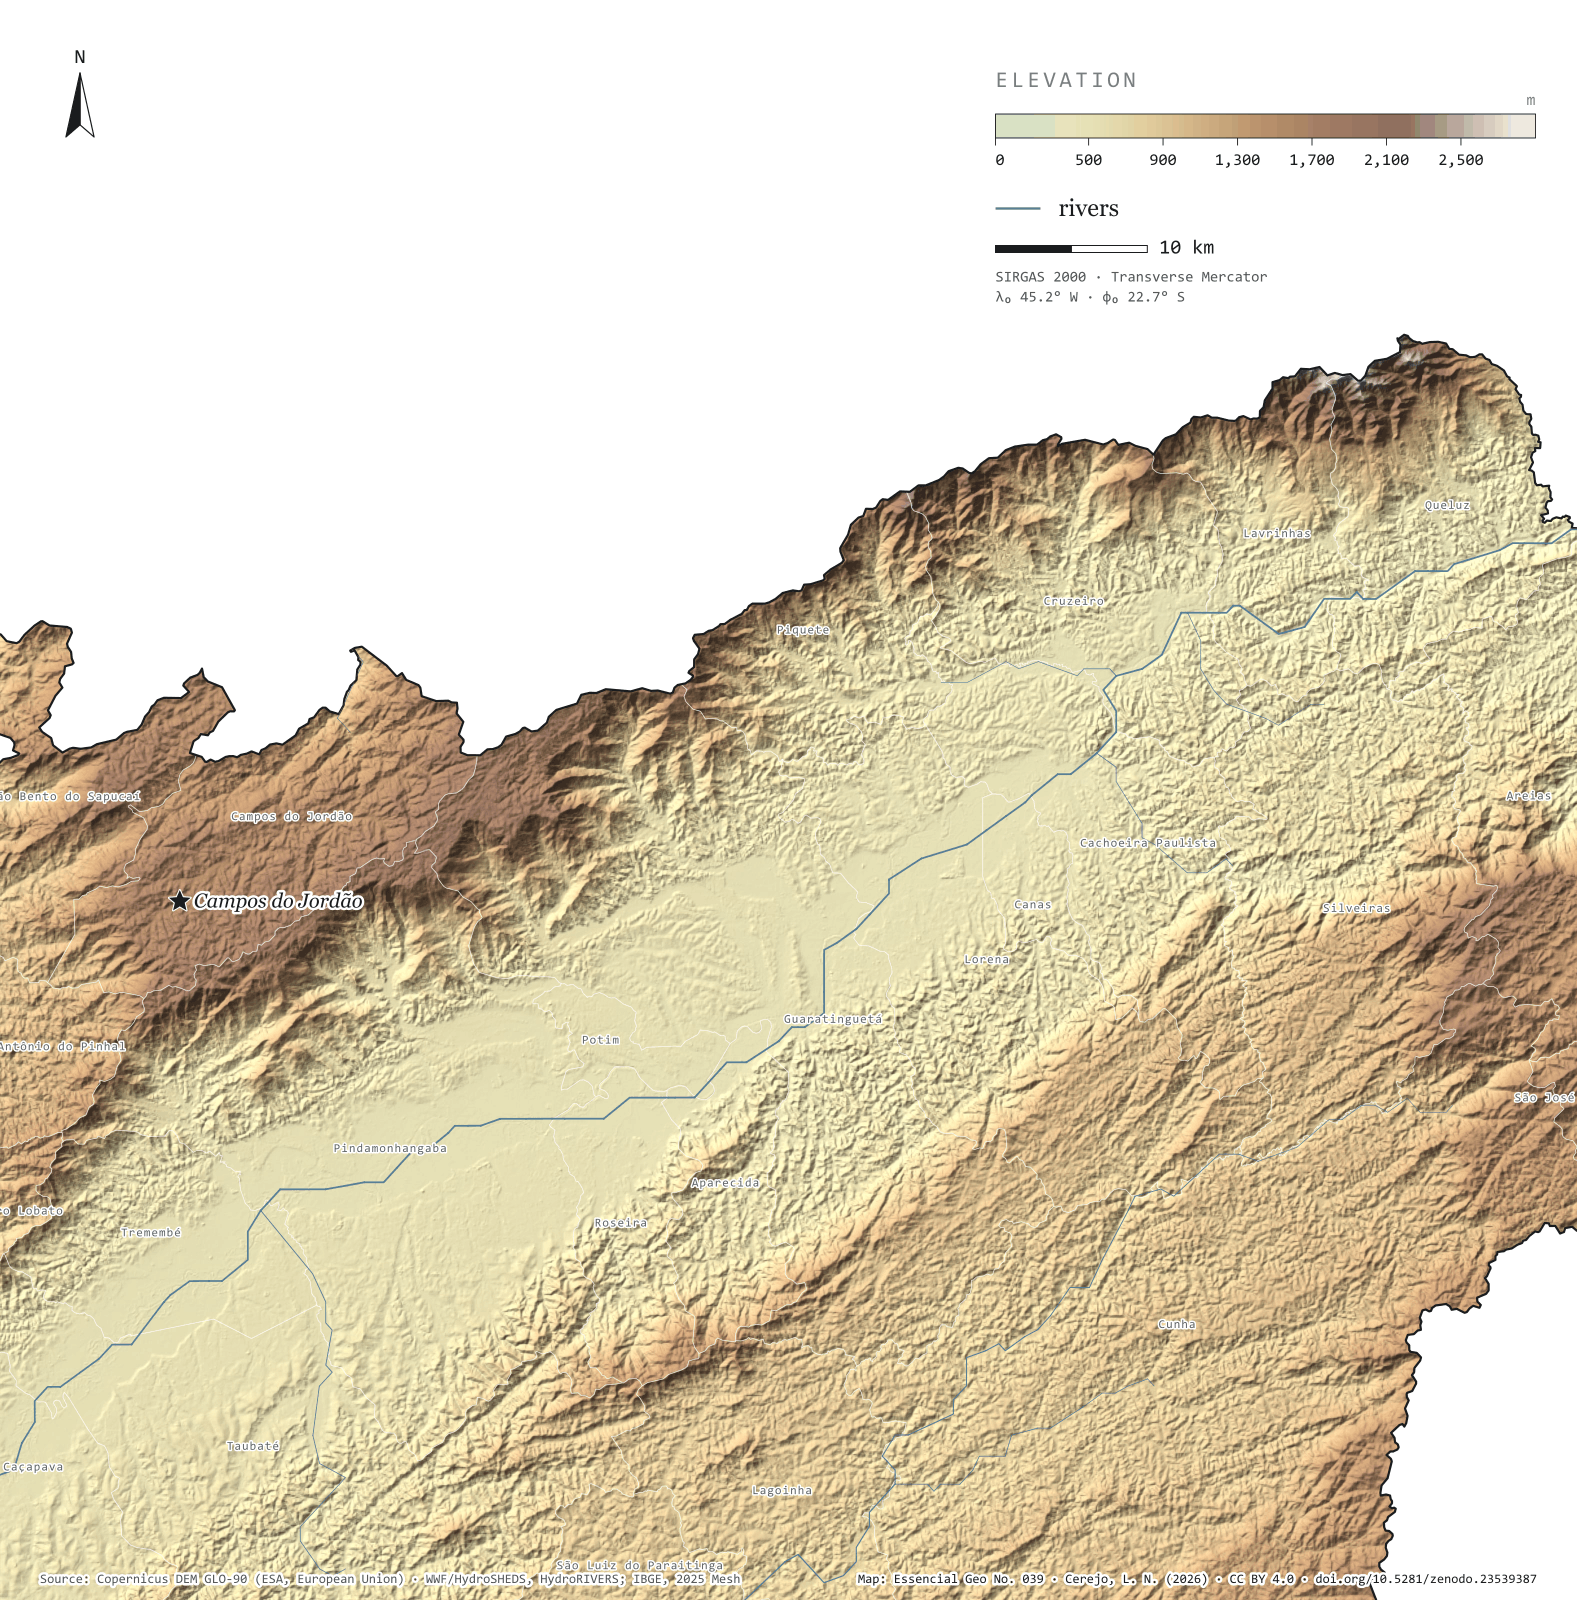
Fig. 039Paraíba valley and Mantiqueira range, between Taubaté and Queluz (SP), with parts of Minas Gerais and Rio de JaneiroEPSG:4674Source: Copernicus DEM GLO-90 (ESA, European Union), digital surface model, 90 m pixels, WWF / HydroSHEDS, IBGE
Profile A–B runs 61 km from the south side of the Paraíba valley to the crest of the Mantiqueira. For almost 40 km the ground barely changes, and the Paraíba do Sul river passes at the lowest point, 501 m. Then the range rises all at once: on the steepest stretch the ground climbs 1,332 m in 5 km, up to 2,581 m on the crest. At the top stands Pedra da Mina, in Queluz, on the Minas Gerais border, the highest point in São Paulo: 2,785 m in the 90 m model. Across the valley, the Serra do Mar closes the corridor through which the river, the Via Dutra motorway and the towns run. In the 10,866 km² frame, mean elevation is 1,007 m and 12.9% of the ground lies above 1,500 m. First plate of the collection “The relief of São Paulo”.
Technical record · downloads · citation
At a glance
Highest point in São Paulo, Pedra da Mina
2,785m
In the 90 m model, in Queluz, on the Minas Gerais border
Largest climb in 5 km along profile A–B
1,332m
Area of the frame by elevation band (km²)
< 500 m83
500–7002,842
700–9001,797
900–1.1002,510
1.100–1.3001,188
1.300–1.5001,050
1.500–1.700775
1.700–1.900441
1.900–2.100113
> 2.100 m68
Layers
relevorasterGeoTIFF of elevation in metres (90 m pixels) clipped to the frame, with the plate’s hypsometric ramp in a .qml style
faixas_altitudepolygon13 elevation bands, every 200 m, with the area of each
perfillineThe A–B profile line, 61.0 km
ponto_mais_altopointPedra da Mina, 2,785 m in the model
municipiospolygonThe 25 São Paulo municipalities in the frame
Copernicus DEM GLO-90 tiles mosaicked, lit from the north-west with relief exaggerated 1.6 times and coloured by elevation band; profile A–B sampled at 600 points.
The map without a frame, with legend, scale, reference system and credit written on it: ready for papers, lectures and slides. In two versions: with the basemap (neighbours and sea) or only the mapped area, on white.
CEREJO, Lucas Nakamura. Serra da Mantiqueira: a muralha sobre o vale do Paraíba. Versão 1.0.0. [S. l.]: Zenodo, 2026. Conjunto de dados. DOI: 10.5281/zenodo.23539387. Disponível em: https://doi.org/10.5281/zenodo.23539387. Acesso em: 10 nov. 2026.
Cerejo, L. N. (2026). Serra da Mantiqueira: a muralha sobre o vale do Paraíba [The Mantiqueira range: The wall above the Paraíba valley] (Version 1.0.0) [Data set]. Zenodo. https://doi.org/10.5281/zenodo.23539387
@dataset{cerejo2026_serra_da_mantiqueira,
  author    = {Cerejo, Lucas Nakamura},
  title     = {Serra da Mantiqueira: A muralha sobre o vale do Paraíba},
  year      = {2026},
  publisher = {Zenodo},
  version   = {1.0.0},
  doi       = {10.5281/zenodo.23539387},
  url       = {https://doi.org/10.5281/zenodo.23539387},
  language  = {portuguese},
  note      = {English title: The Mantiqueira range: The wall above the Paraíba valley. Licence CC BY 4.0}
}
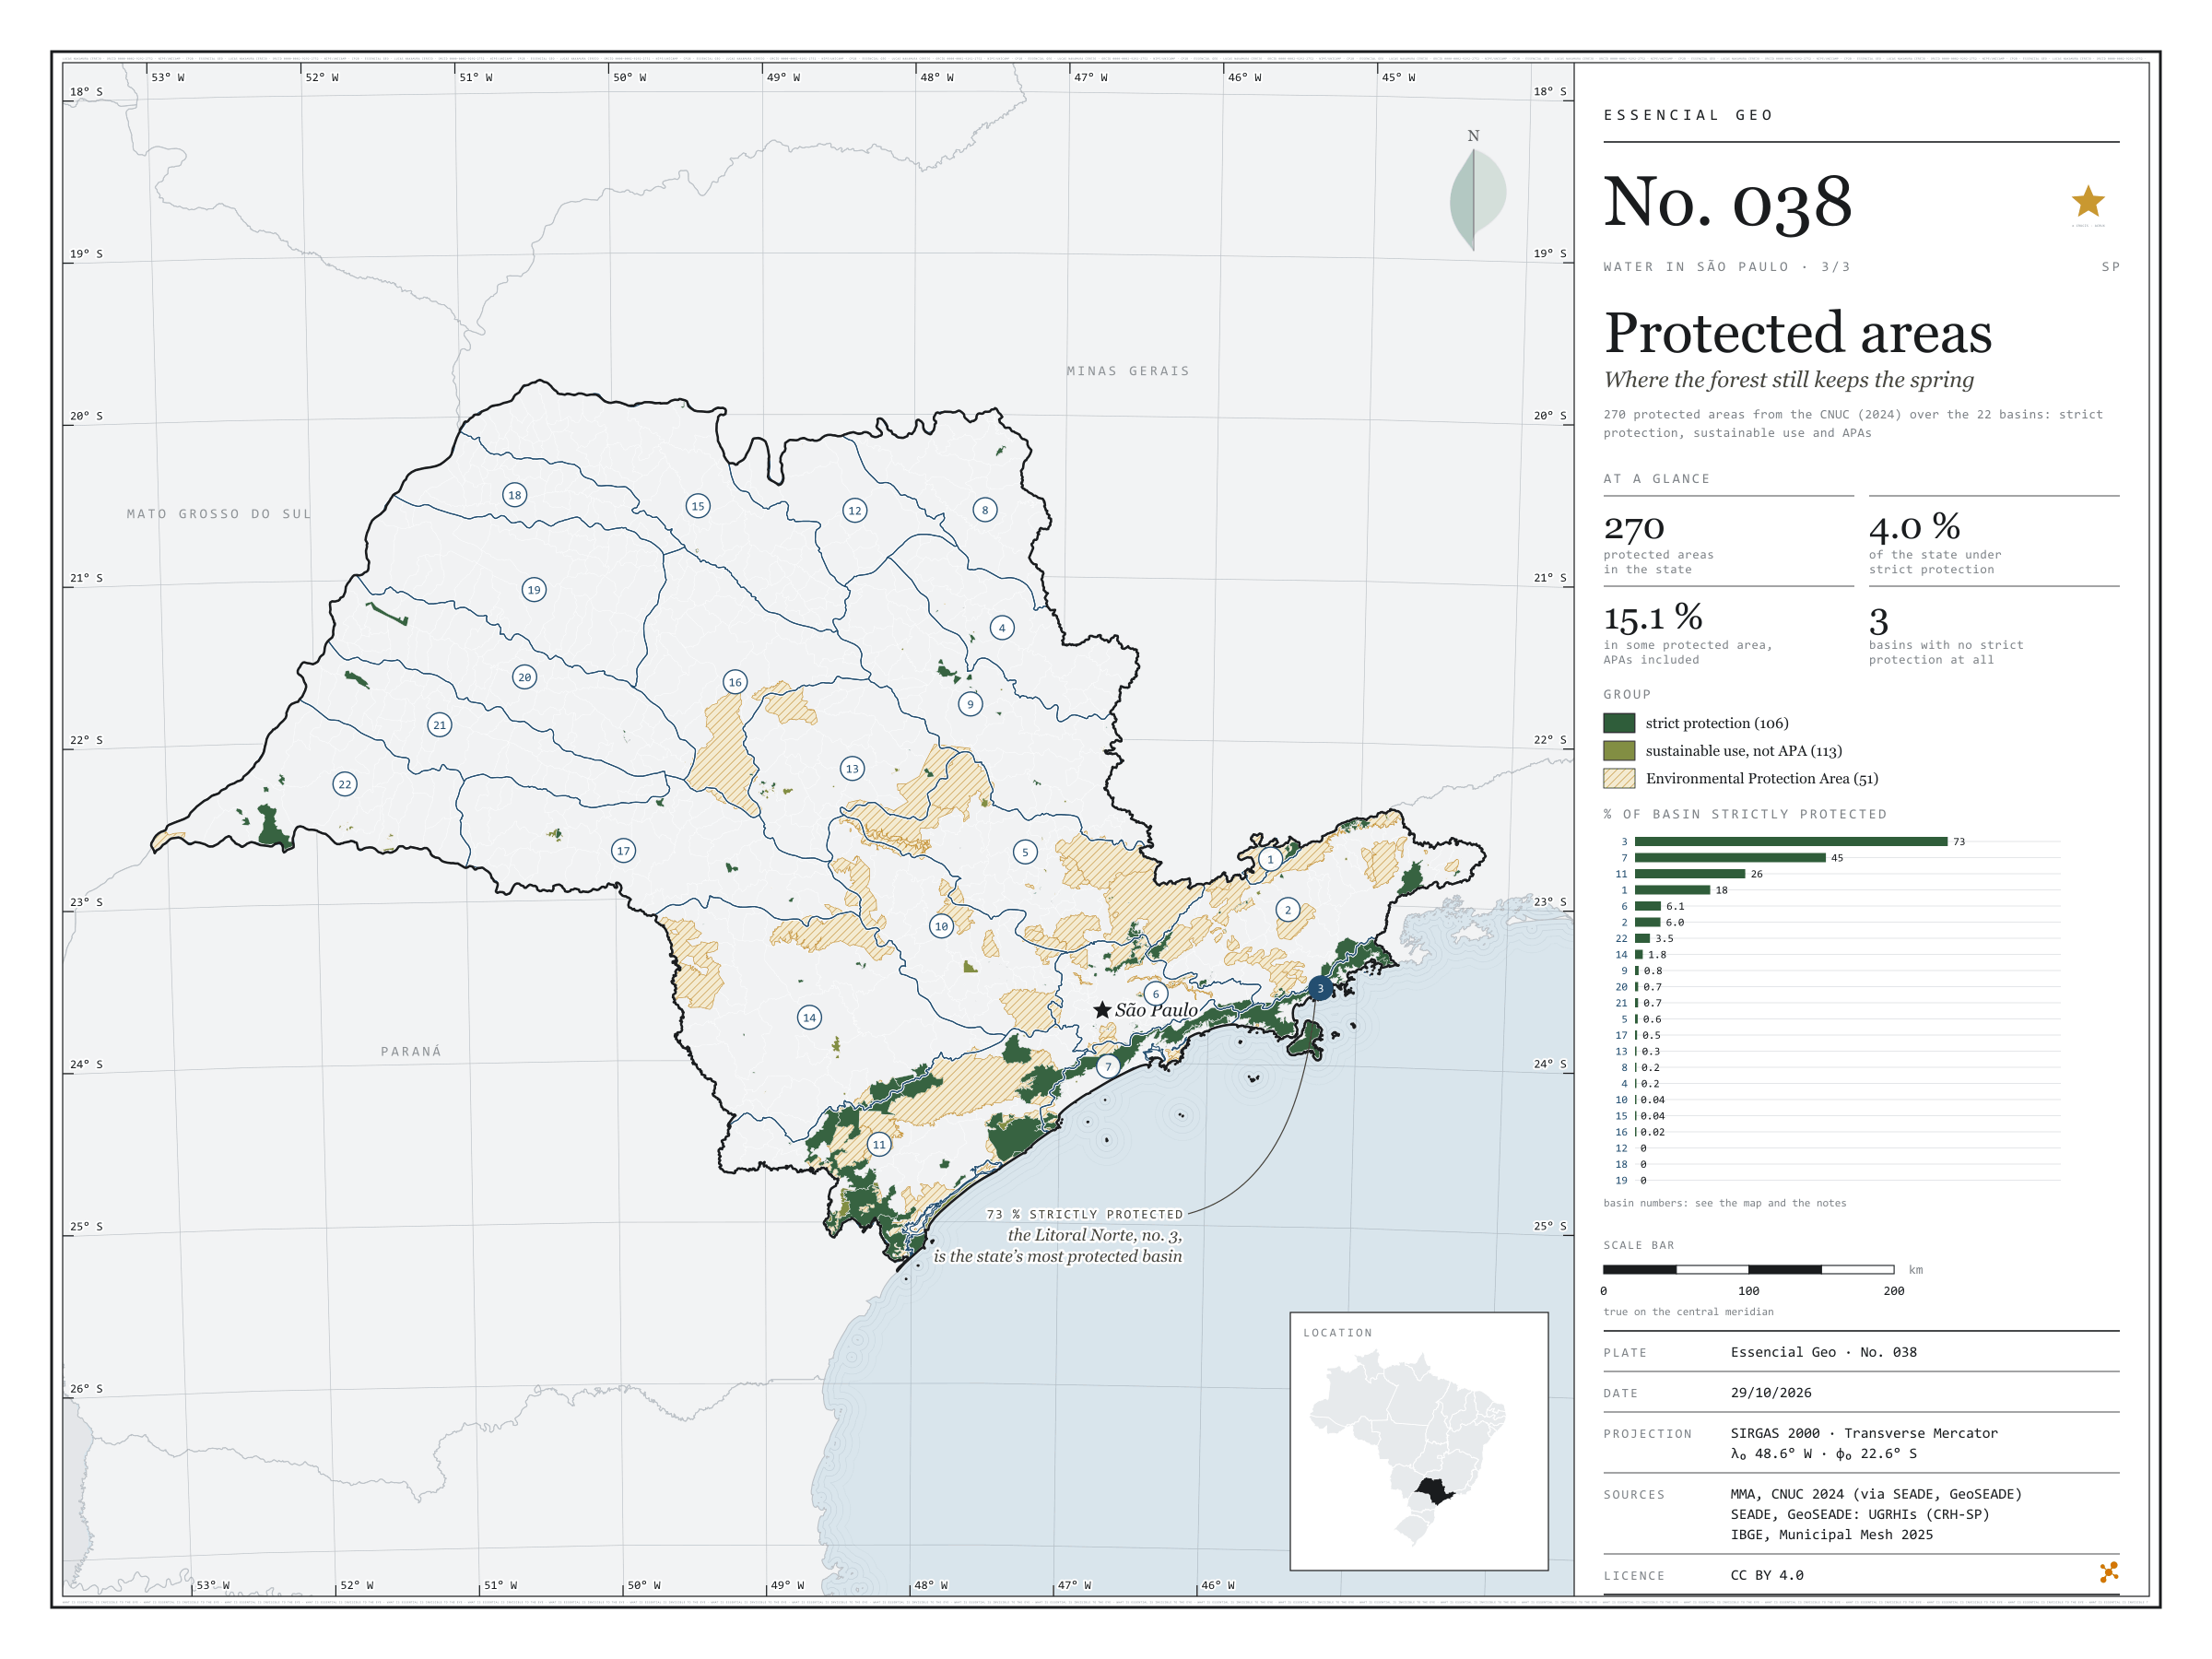
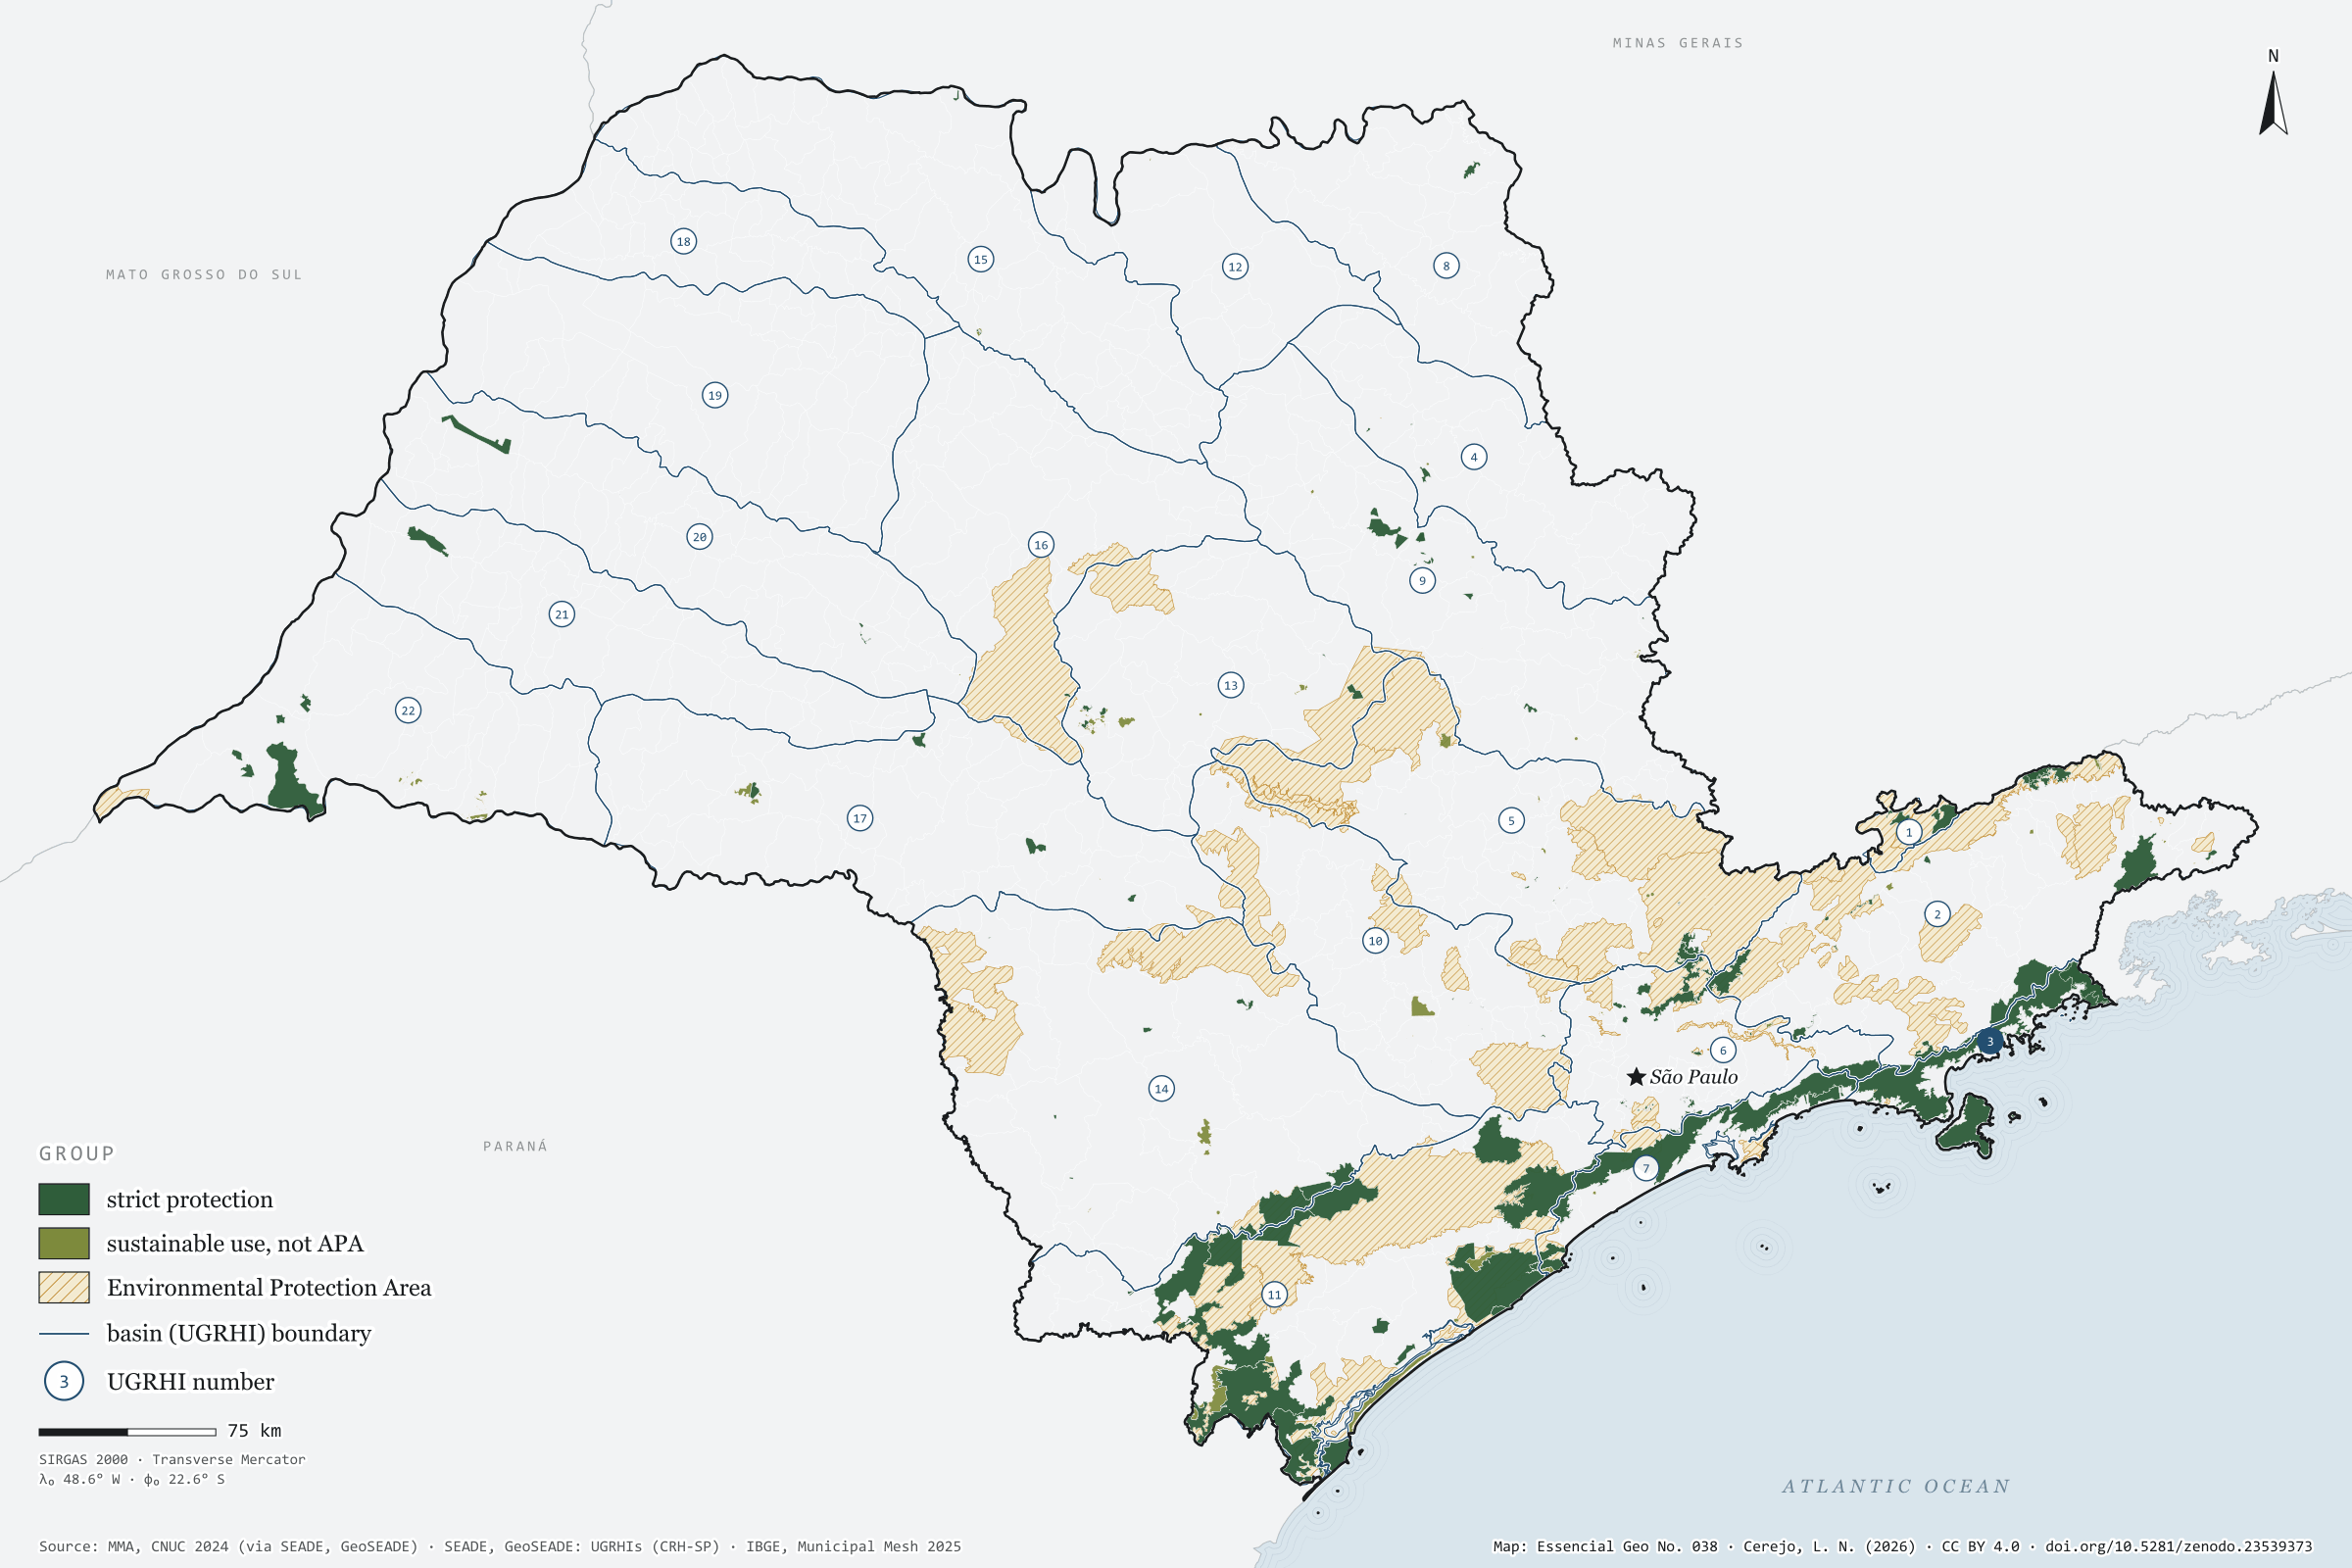
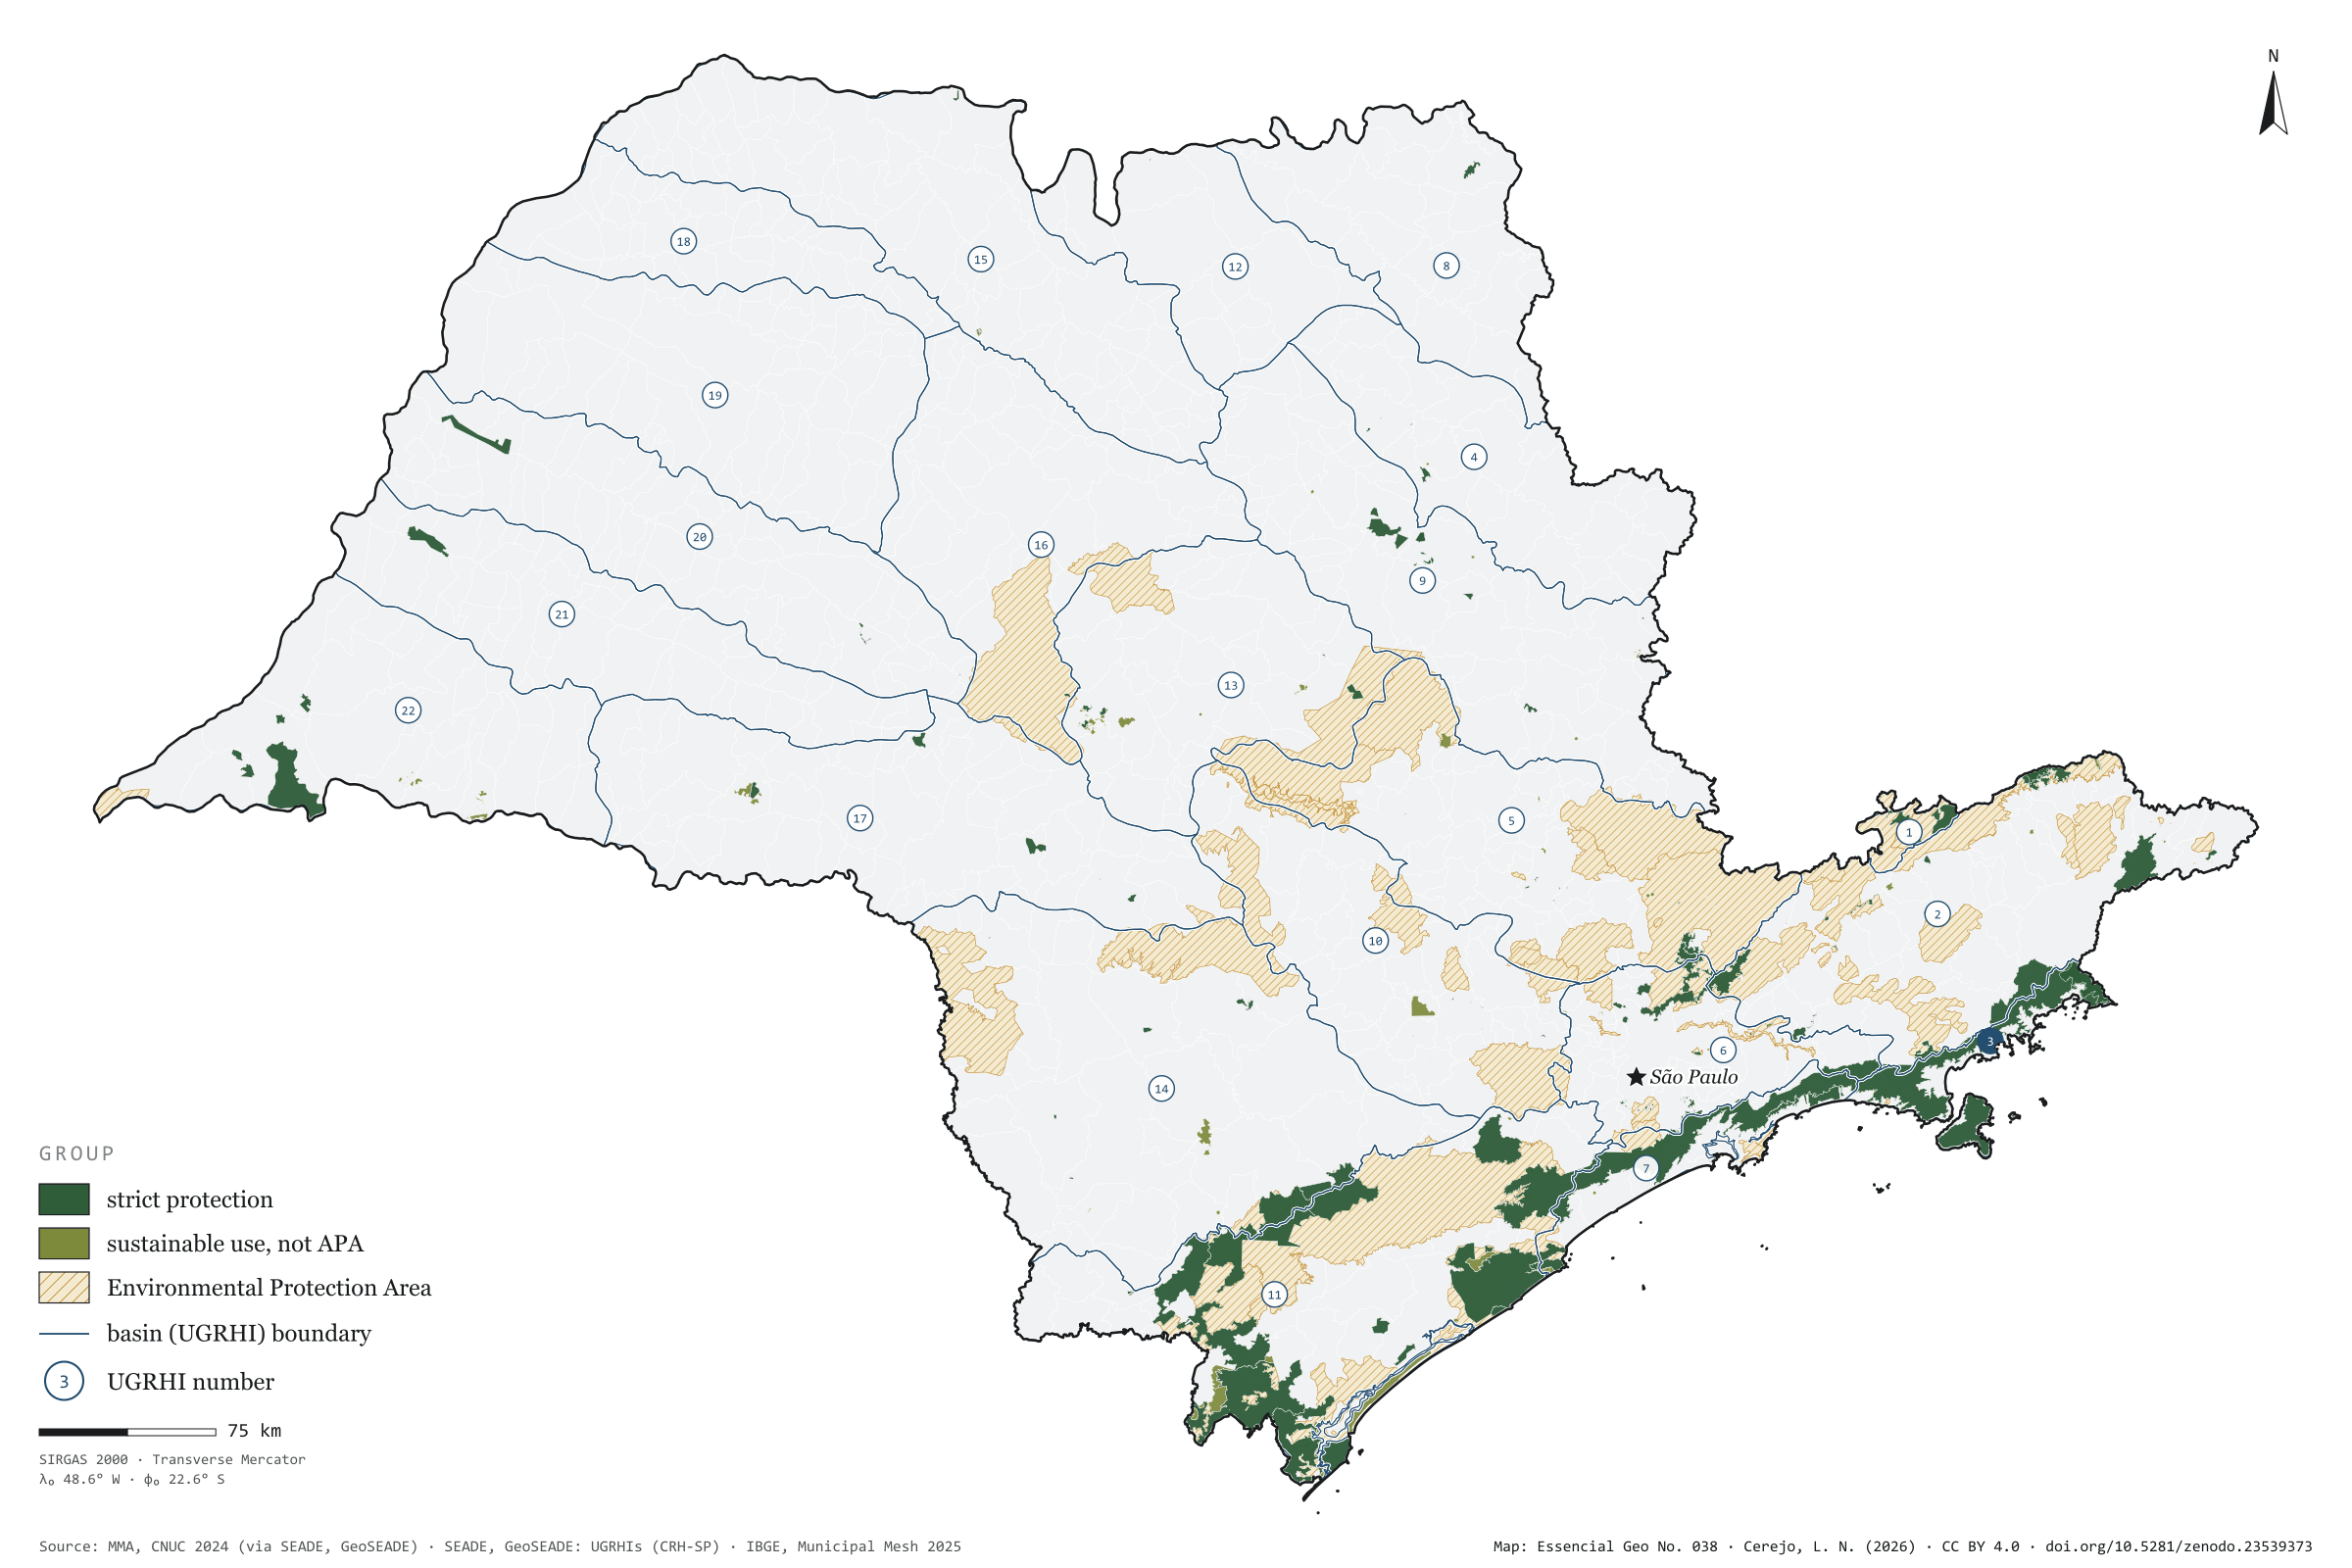
Fig. 038São Paulo state (SP)EPSG:4674Source: MMA, SEADE, IBGE
In the Litoral Norte, 73% of the basin lies in strictly protected areas, most of it in the Serra do Mar State Park. In the west of the state, three basins — Baixo Tietê, São José dos Dourados and Baixo Pardo/Grande — have none at all. Taken together, the 270 protected areas in the CNUC for São Paulo cover 15.1% of the territory, but only 4.0% under strict protection; nearly all the rest are Environmental Protection Areas, which allow settlement under rules. Over the 22 basins, the map shows where protected forest still keeps the springs: in the Serra do Mar and the Ribeira valley. Final plate of the collection “Water in São Paulo”.
Technical record · downloads · citation
At a glance
Share of basin under strict protection (top six) (%)
3 · Litoral Norte73
7 · Baixada Santista45
11 · Ribeira de Iguape/Litoral Sul26
1 · Mantiqueira18
6 · Alto Tietê6.1
2 · Paraíba do Sul6
São Paulo’s territory in protected areas
15%
4.0% strictly protected; 51 APAs among the 270 units
Layers
unidades_conservacaopolygon270 protected areas: category, group, sphere, founding act and area in SP
ugrhipolygon22 UGRHIs with the area and share under strict protection and in any protected area
The map without a frame, with legend, scale, reference system and credit written on it: ready for papers, lectures and slides. In two versions: with the basemap (neighbours and sea) or only the mapped area, on white.
CEREJO, Lucas Nakamura. Unidades de conservação: onde a floresta ainda guarda a nascente. Versão 1.0.0. [S. l.]: Zenodo, 2026. Conjunto de dados. DOI: 10.5281/zenodo.23539373. Disponível em: https://doi.org/10.5281/zenodo.23539373. Acesso em: 10 nov. 2026.
Cerejo, L. N. (2026). Unidades de conservação: onde a floresta ainda guarda a nascente [Protected areas: Where the forest still keeps the spring] (Version 1.0.0) [Data set]. Zenodo. https://doi.org/10.5281/zenodo.23539373
@dataset{cerejo2026_unidades_de_conservacao_sp,
  author    = {Cerejo, Lucas Nakamura},
  title     = {Unidades de conservação: Onde a floresta ainda guarda a nascente},
  year      = {2026},
  publisher = {Zenodo},
  version   = {1.0.0},
  doi       = {10.5281/zenodo.23539373},
  url       = {https://doi.org/10.5281/zenodo.23539373},
  language  = {portuguese},
  note      = {English title: Protected areas: Where the forest still keeps the spring. Licence CC BY 4.0}
}
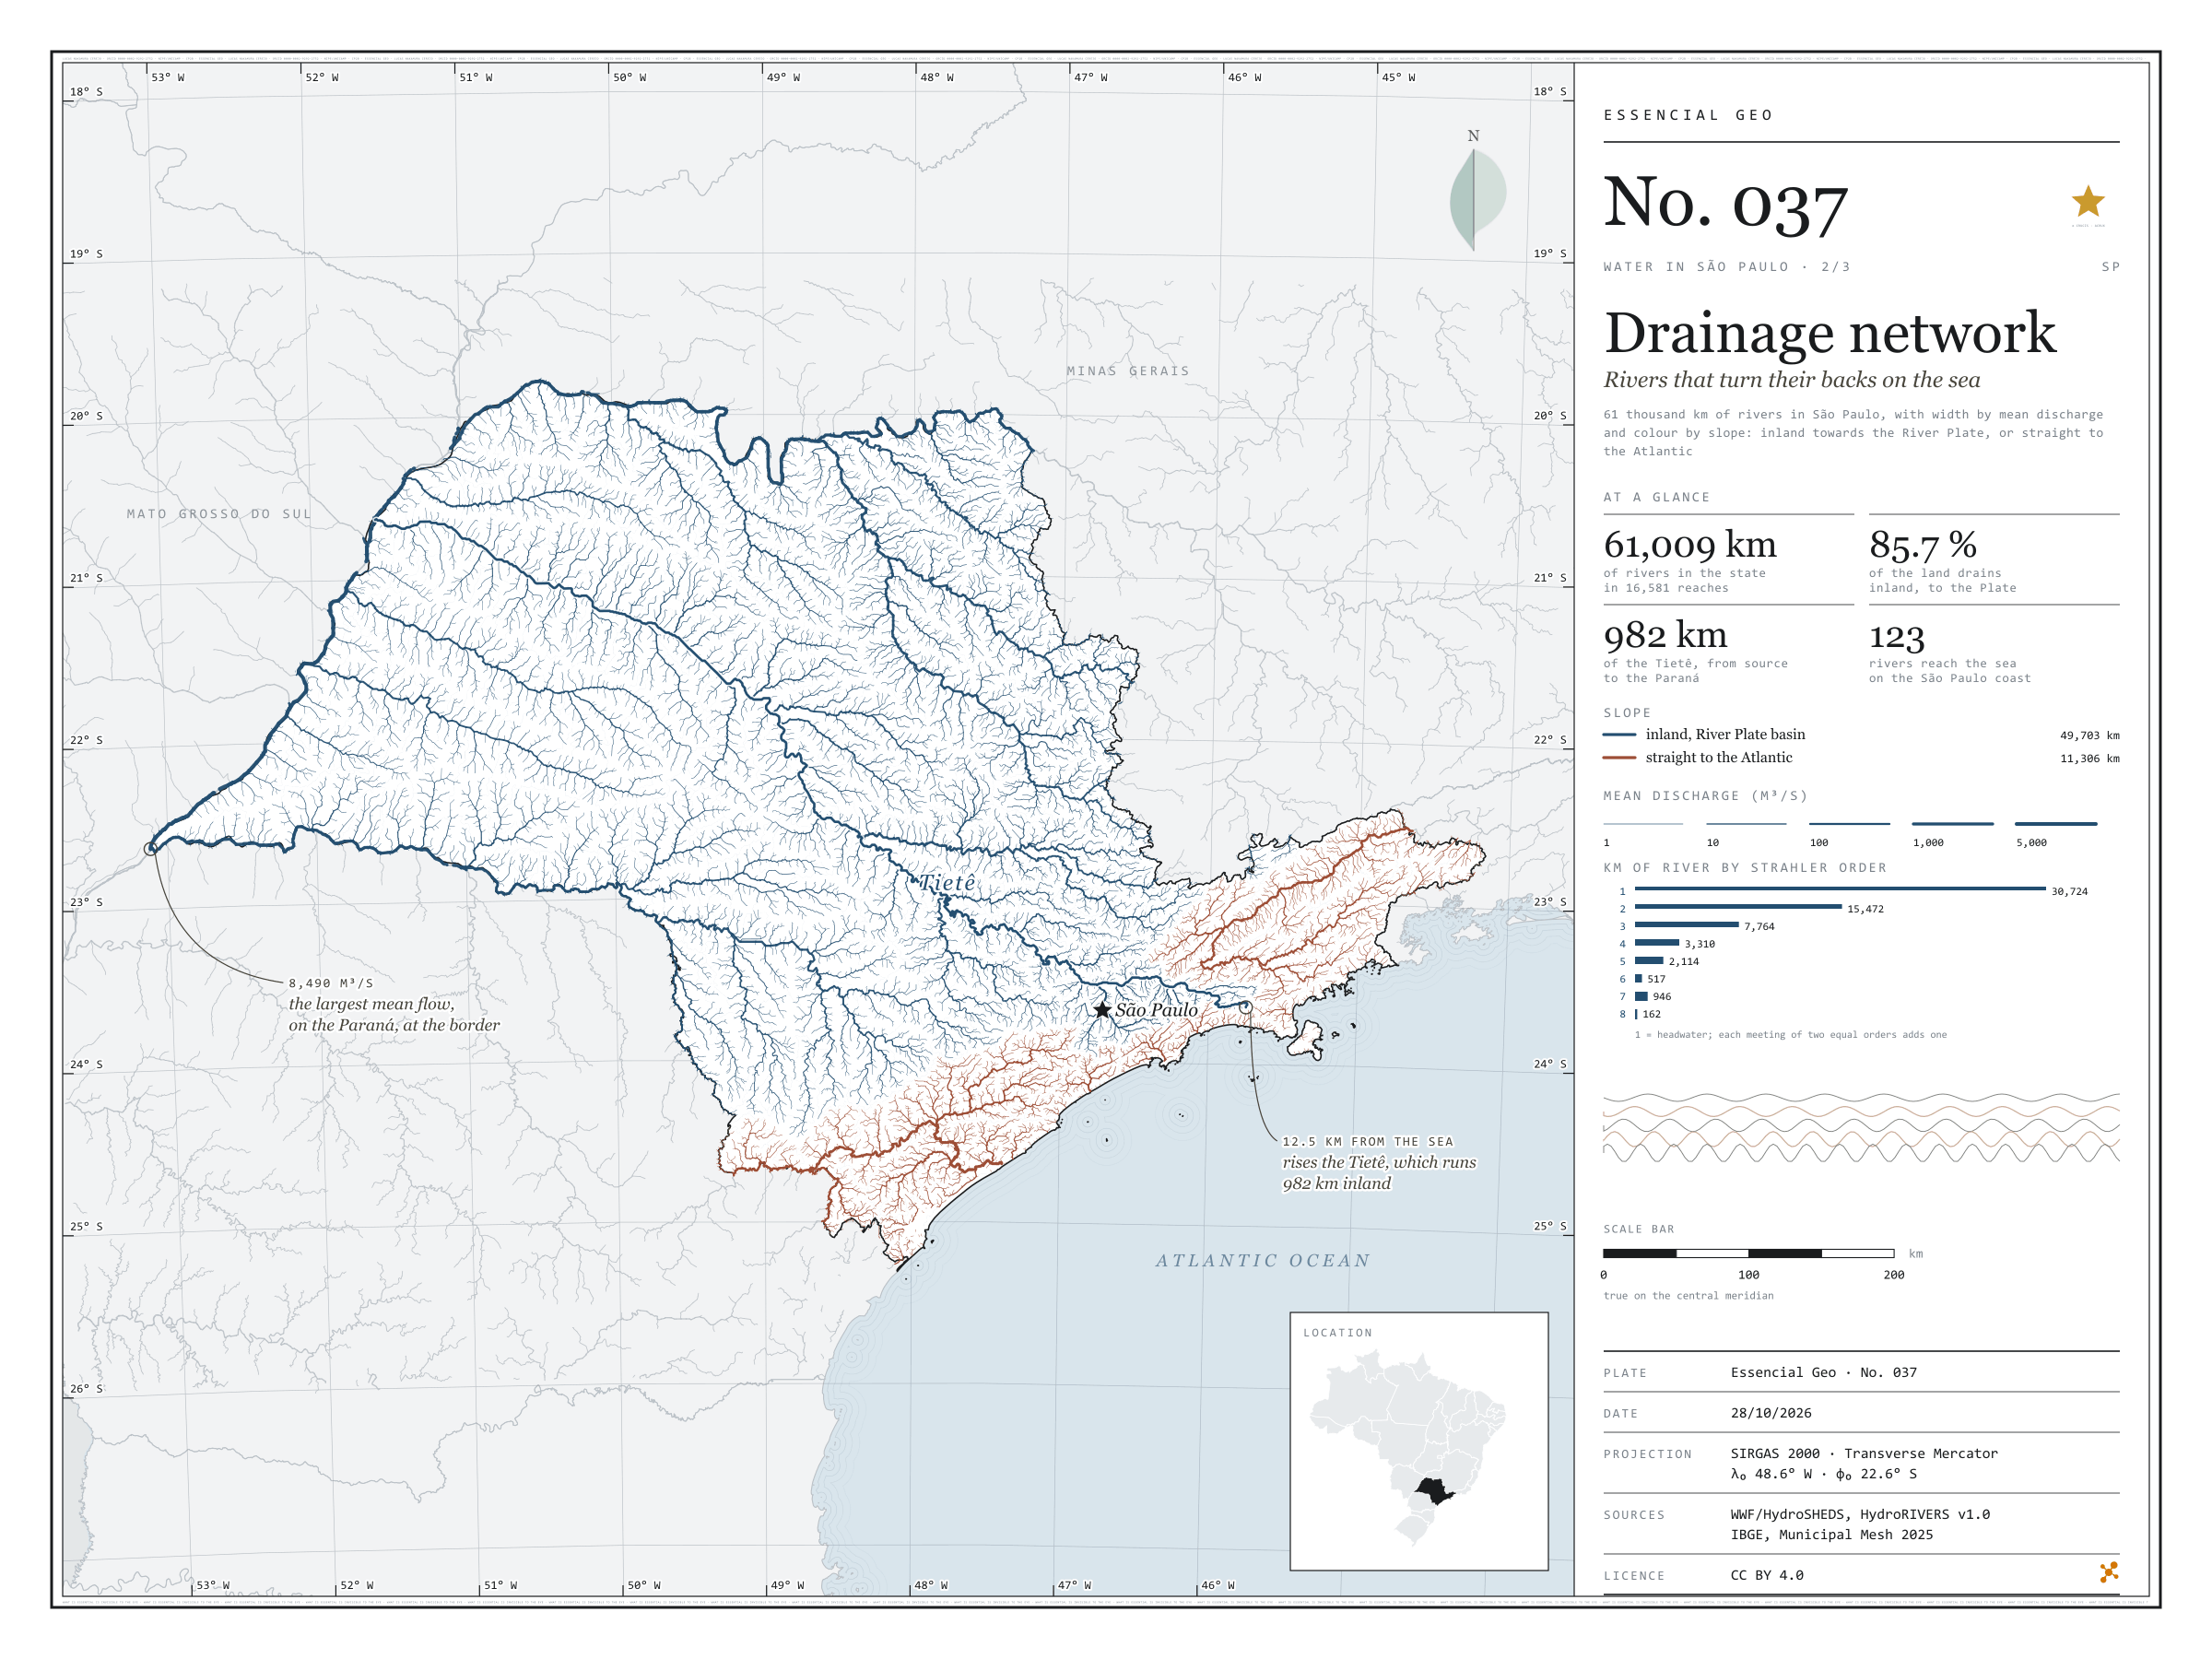
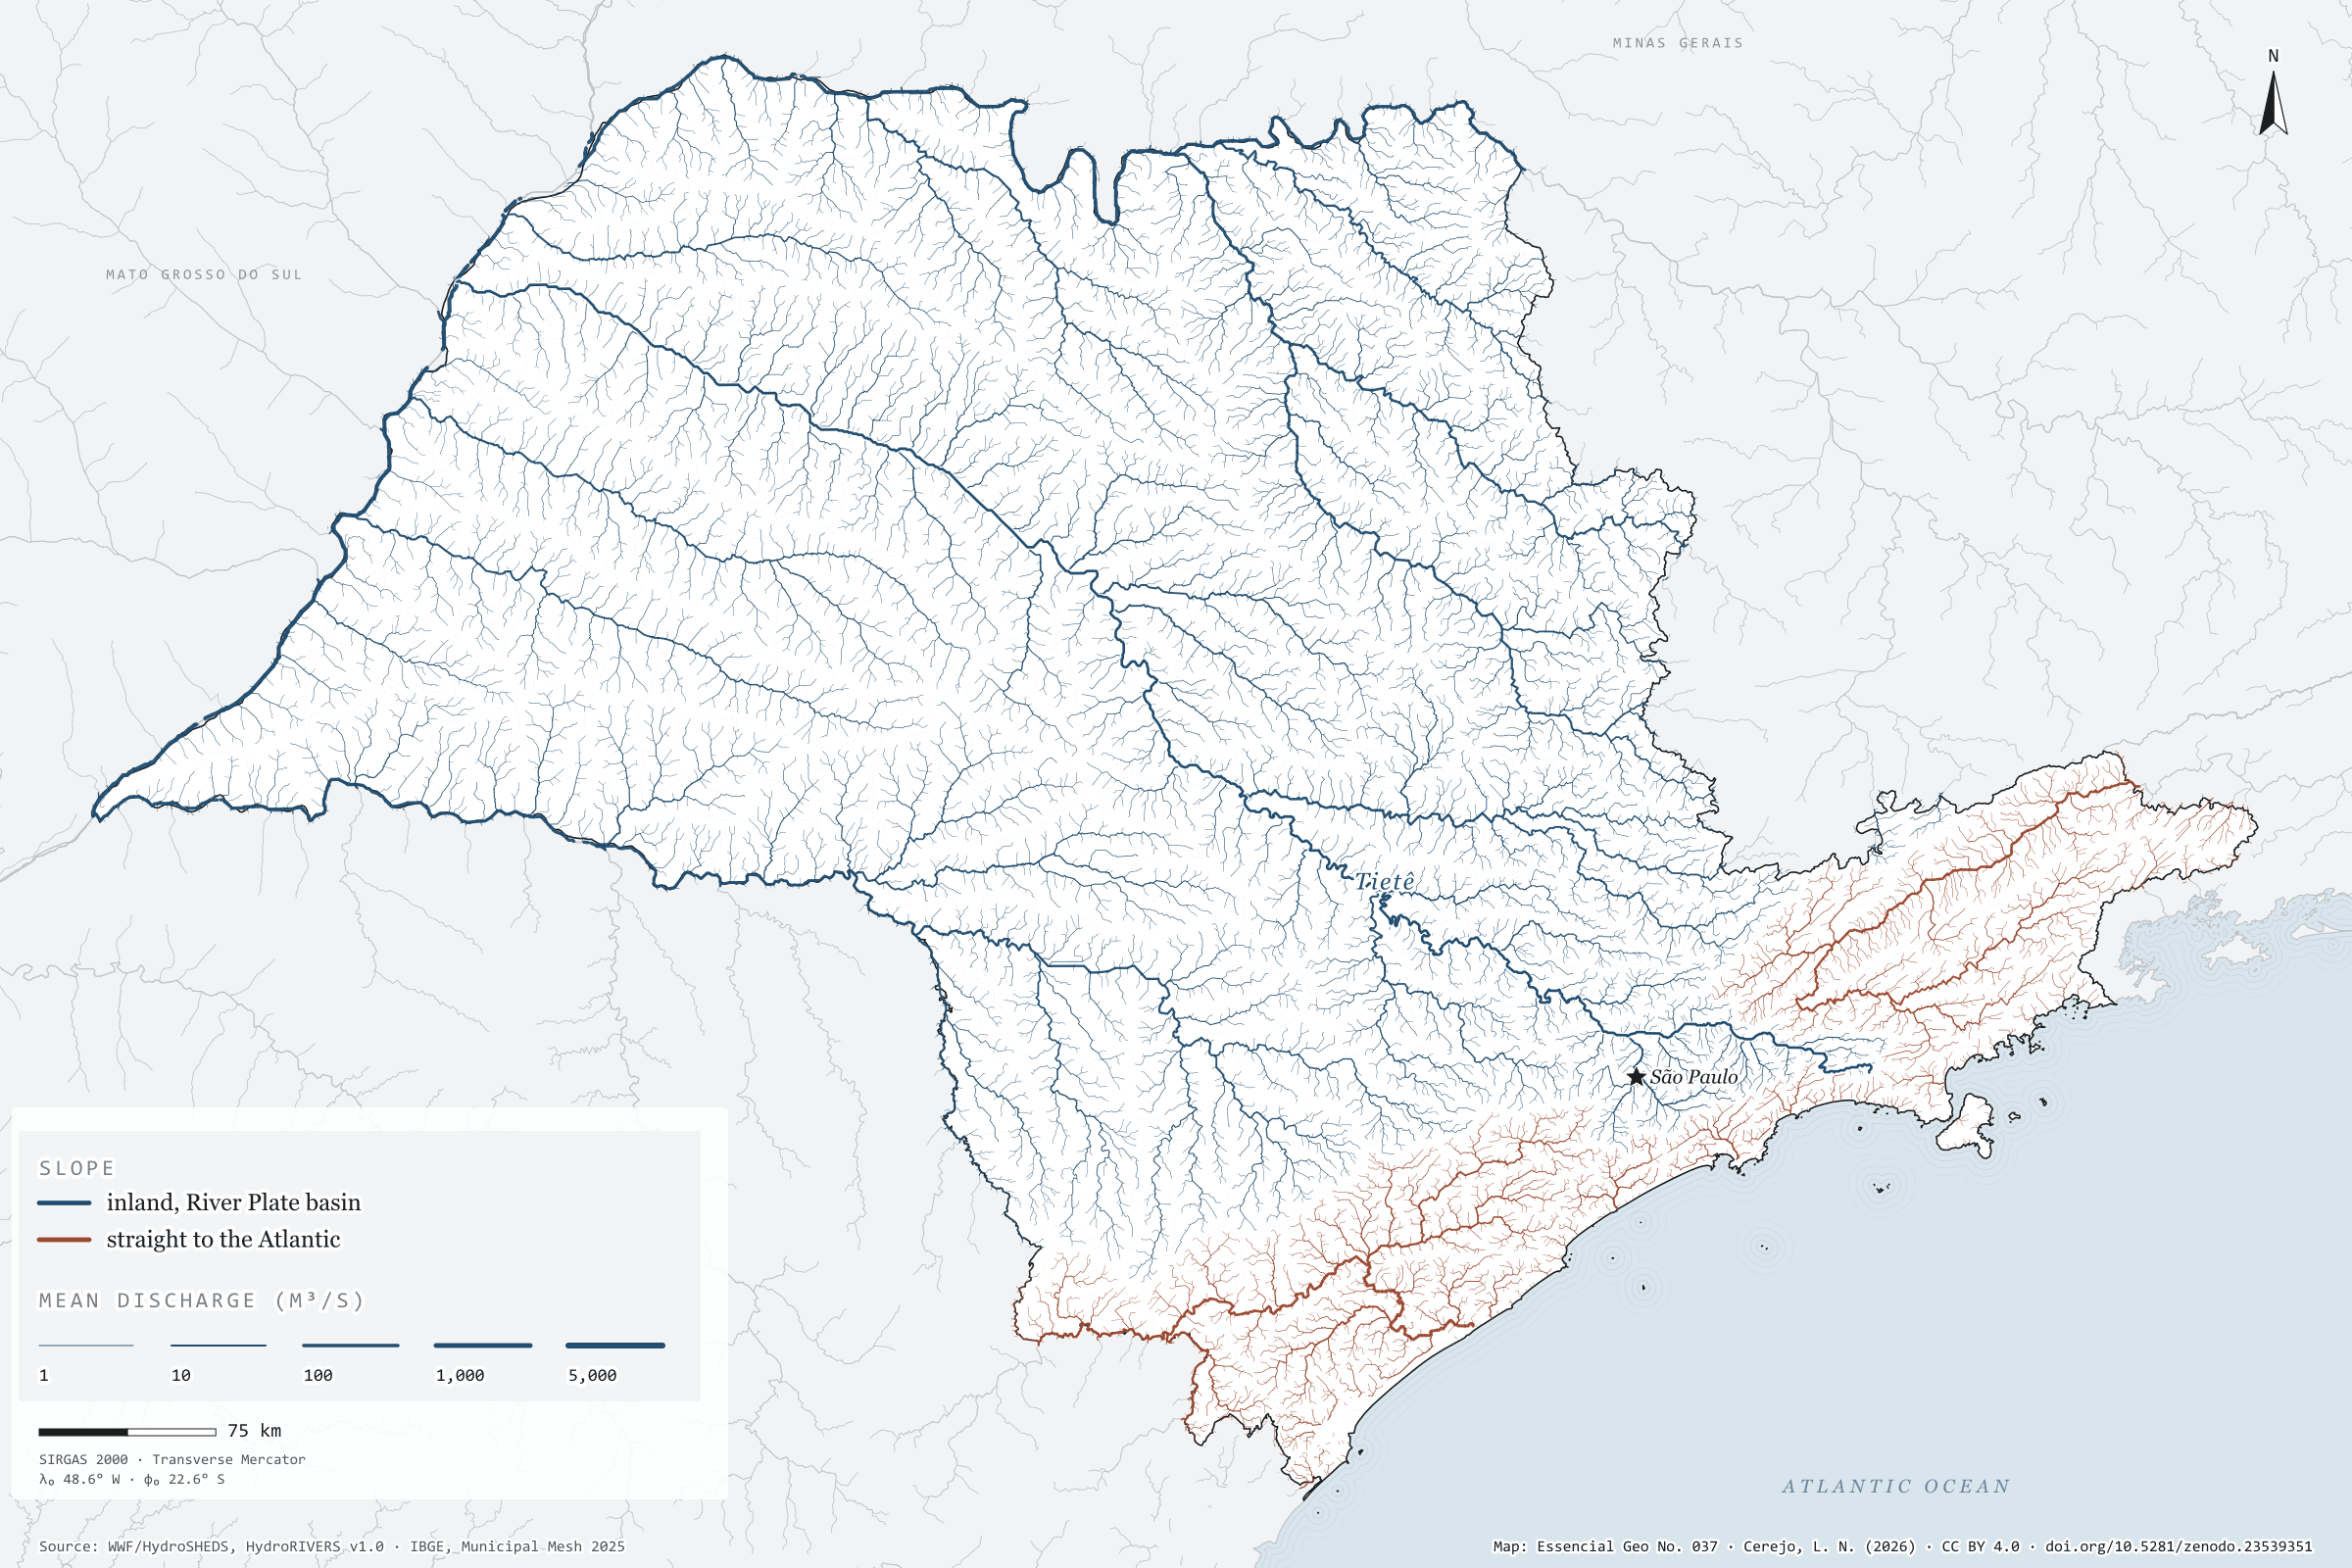
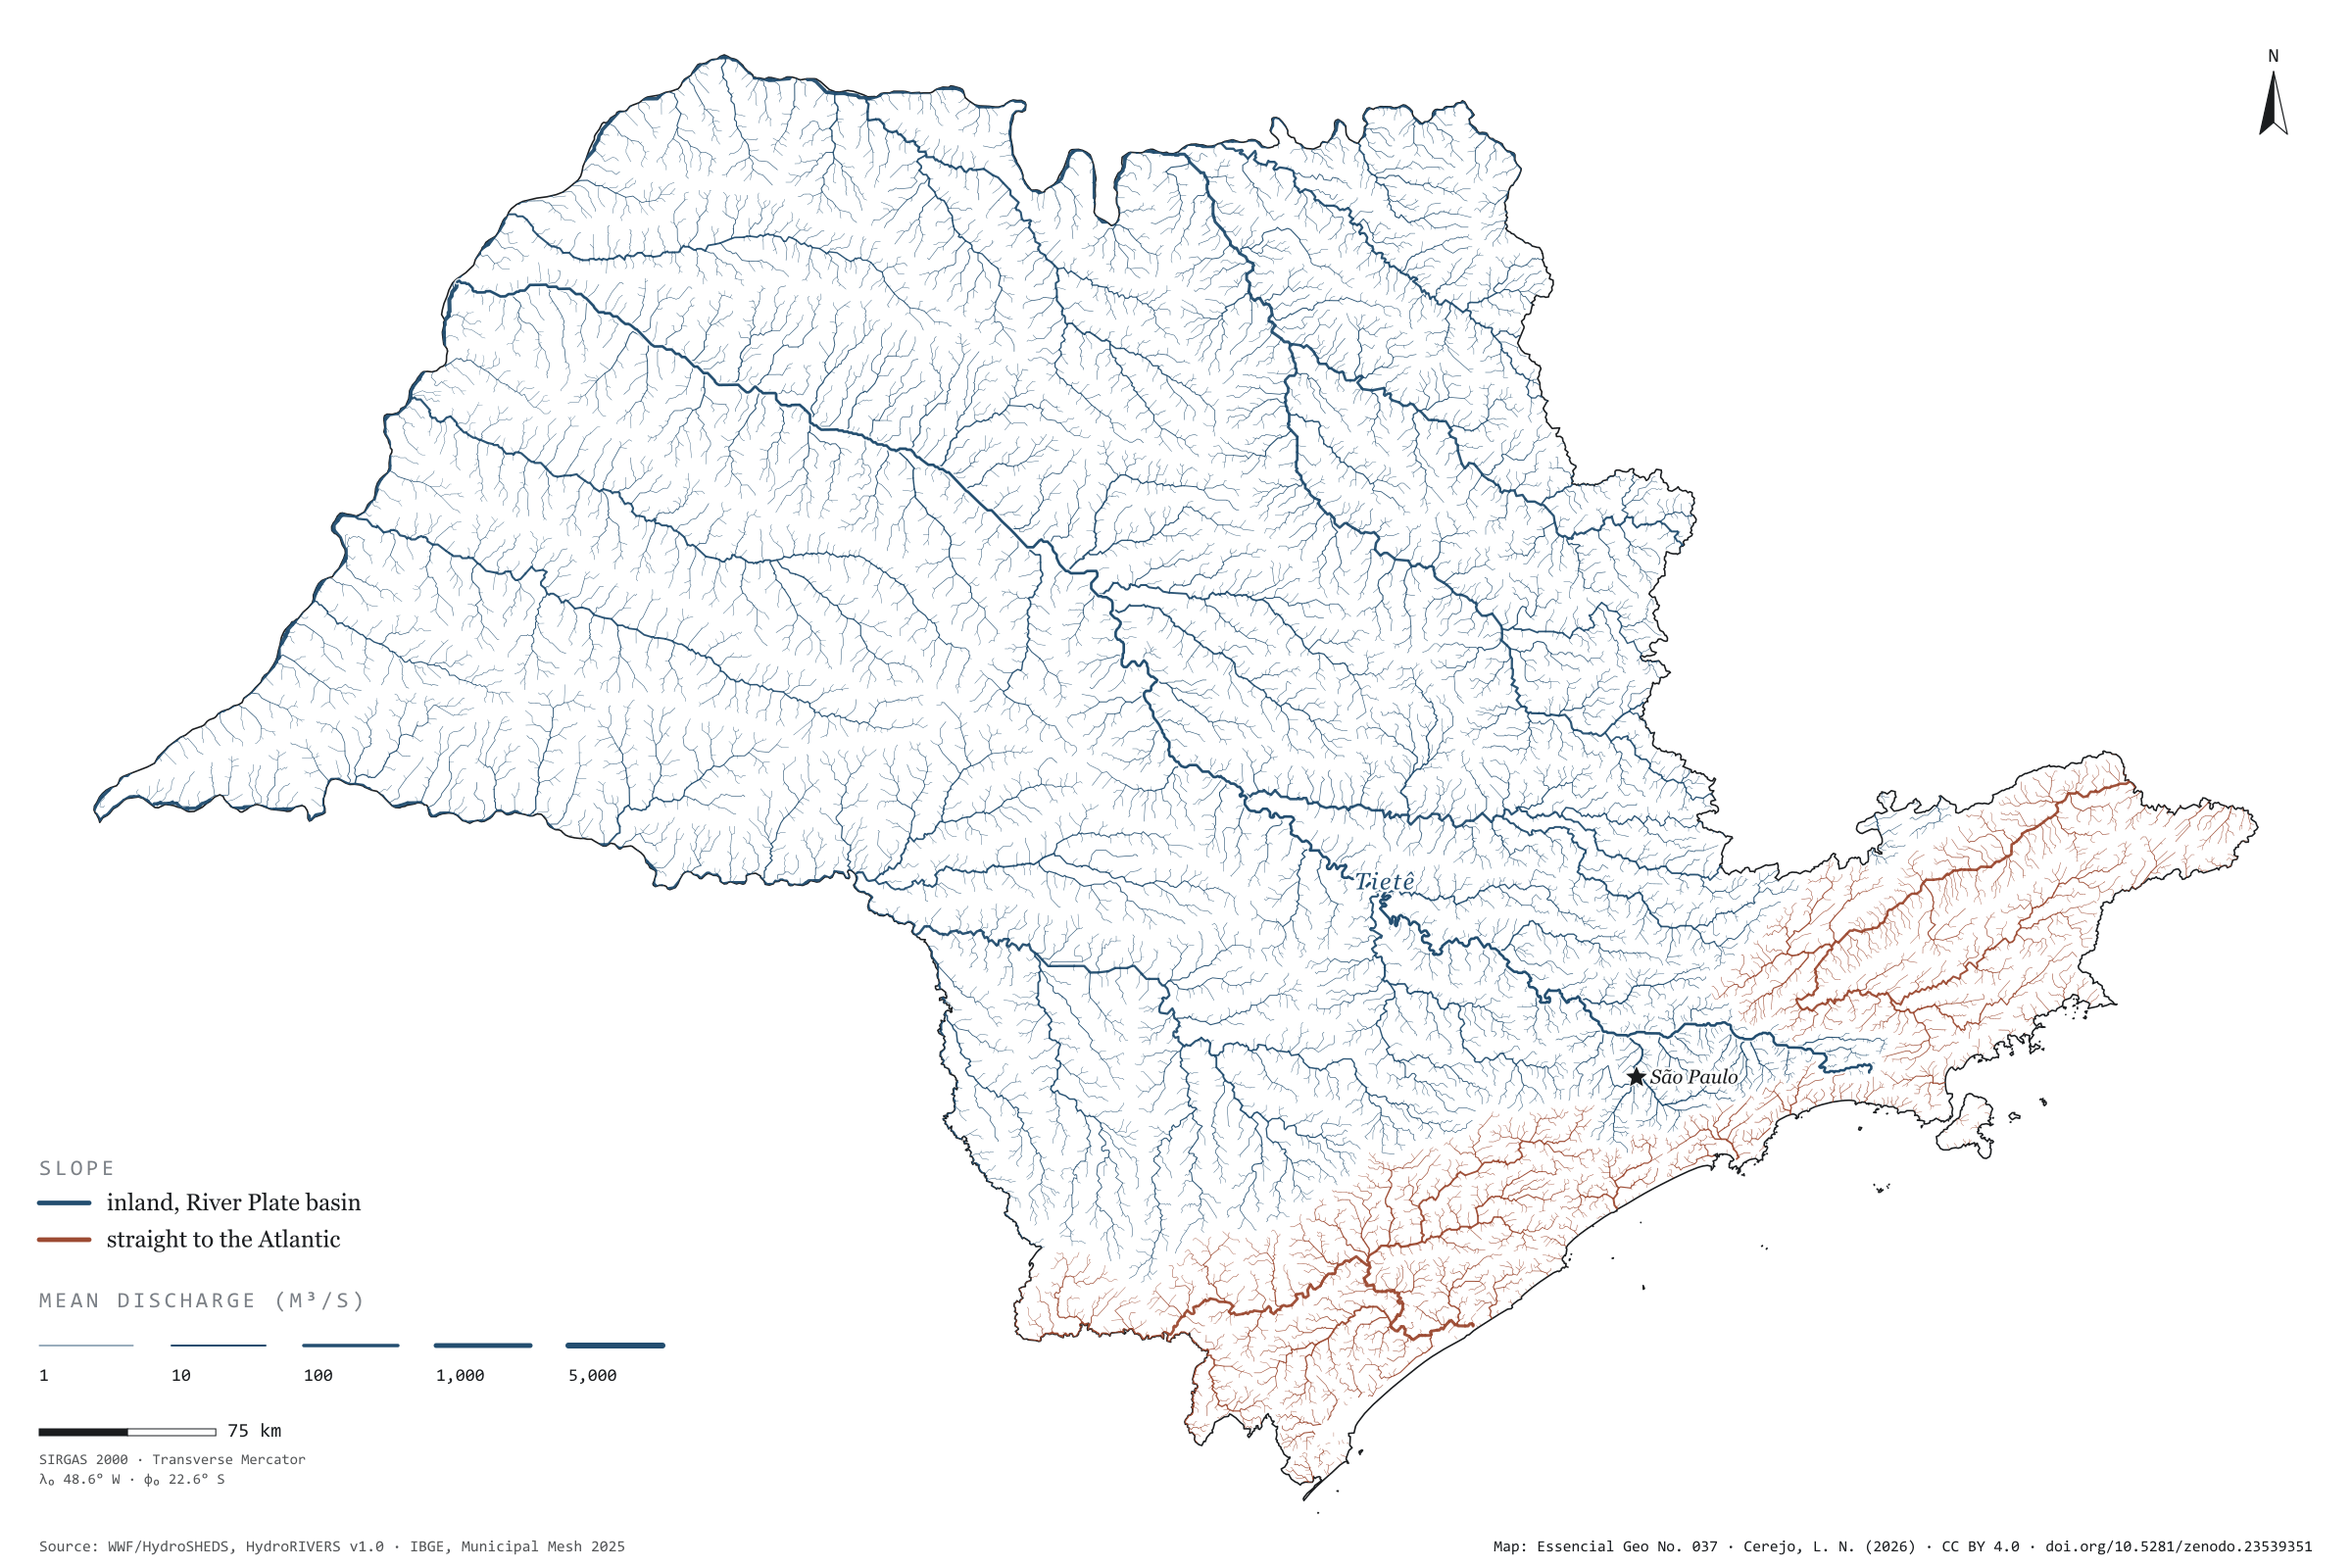
Fig. 037State of São Paulo (SP)EPSG:4674Source: WWF / HydroSHEDS, IBGE
The Tietê rises 12.5 km from the sea and runs 982 km the other way, inland, to the Paraná. It is not alone: 85.7% of the area drained by São Paulo’s rivers flows inland and on down the Paraná to the River Plate, between Argentina and Uruguay. The Serra do Mar and the Mantiqueira divide the waters. Only the coastal strip, the Ribeira de Iguape and the Paraíba do Sul valley send their rain straight to the Atlantic, through 123 river mouths on the São Paulo coast. The map draws 61,009 km of rivers, each reach as wide as its mean discharge: from headwater streams to the Paraná on the state border, with 8,490 m³/s. Second plate of the collection “Water in São Paulo”.
Technical record · downloads · citation
At a glance
Kilometres of river in São Paulo, by slope (km)
Para o interior, bacia do Prata81.5%
Direto para o Atlântico18.5%
Kilometres of river by Strahler order (km)
130,724
215,472
37,764
43,310
52,114
6517
7946
8162
Drained area flowing inland
86%
The rest flows straight to the Atlantic, through 123 mouths on the São Paulo coast
Layers
riosline16,999 river reaches in the state and on its border: length, upstream area, mean discharge, Strahler order and slope
tietelineThe Tietê from its source to the Paraná, 982 km
HydroRIVERS reaches clipped to São Paulo, with width by modelled mean discharge and slope by the outlet of the river system; the Tietê traced from mouth to source along the reach with the largest upstream area.
The map without a frame, with legend, scale, reference system and credit written on it: ready for papers, lectures and slides. In two versions: with the basemap (neighbours and sea) or only the mapped area, on white.
CEREJO, Lucas Nakamura. Rede de drenagem: os rios que dão as costas ao mar. Versão 1.0.0. [S. l.]: Zenodo, 2026. Conjunto de dados. DOI: 10.5281/zenodo.23539351. Disponível em: https://doi.org/10.5281/zenodo.23539351. Acesso em: 10 nov. 2026.
Cerejo, L. N. (2026). Rede de drenagem: os rios que dão as costas ao mar [Drainage network: Rivers that turn their backs on the sea] (Version 1.0.0) [Data set]. Zenodo. https://doi.org/10.5281/zenodo.23539351
@dataset{cerejo2026_drenagem_sp,
  author    = {Cerejo, Lucas Nakamura},
  title     = {Rede de drenagem: Os rios que dão as costas ao mar},
  year      = {2026},
  publisher = {Zenodo},
  version   = {1.0.0},
  doi       = {10.5281/zenodo.23539351},
  url       = {https://doi.org/10.5281/zenodo.23539351},
  language  = {portuguese},
  note      = {English title: Drainage network: Rivers that turn their backs on the sea. Licence CC BY 4.0}
}