Fig. 036São Paulo state (SP)EPSG:4674Source: SEADE, IBGE, MapBiomas
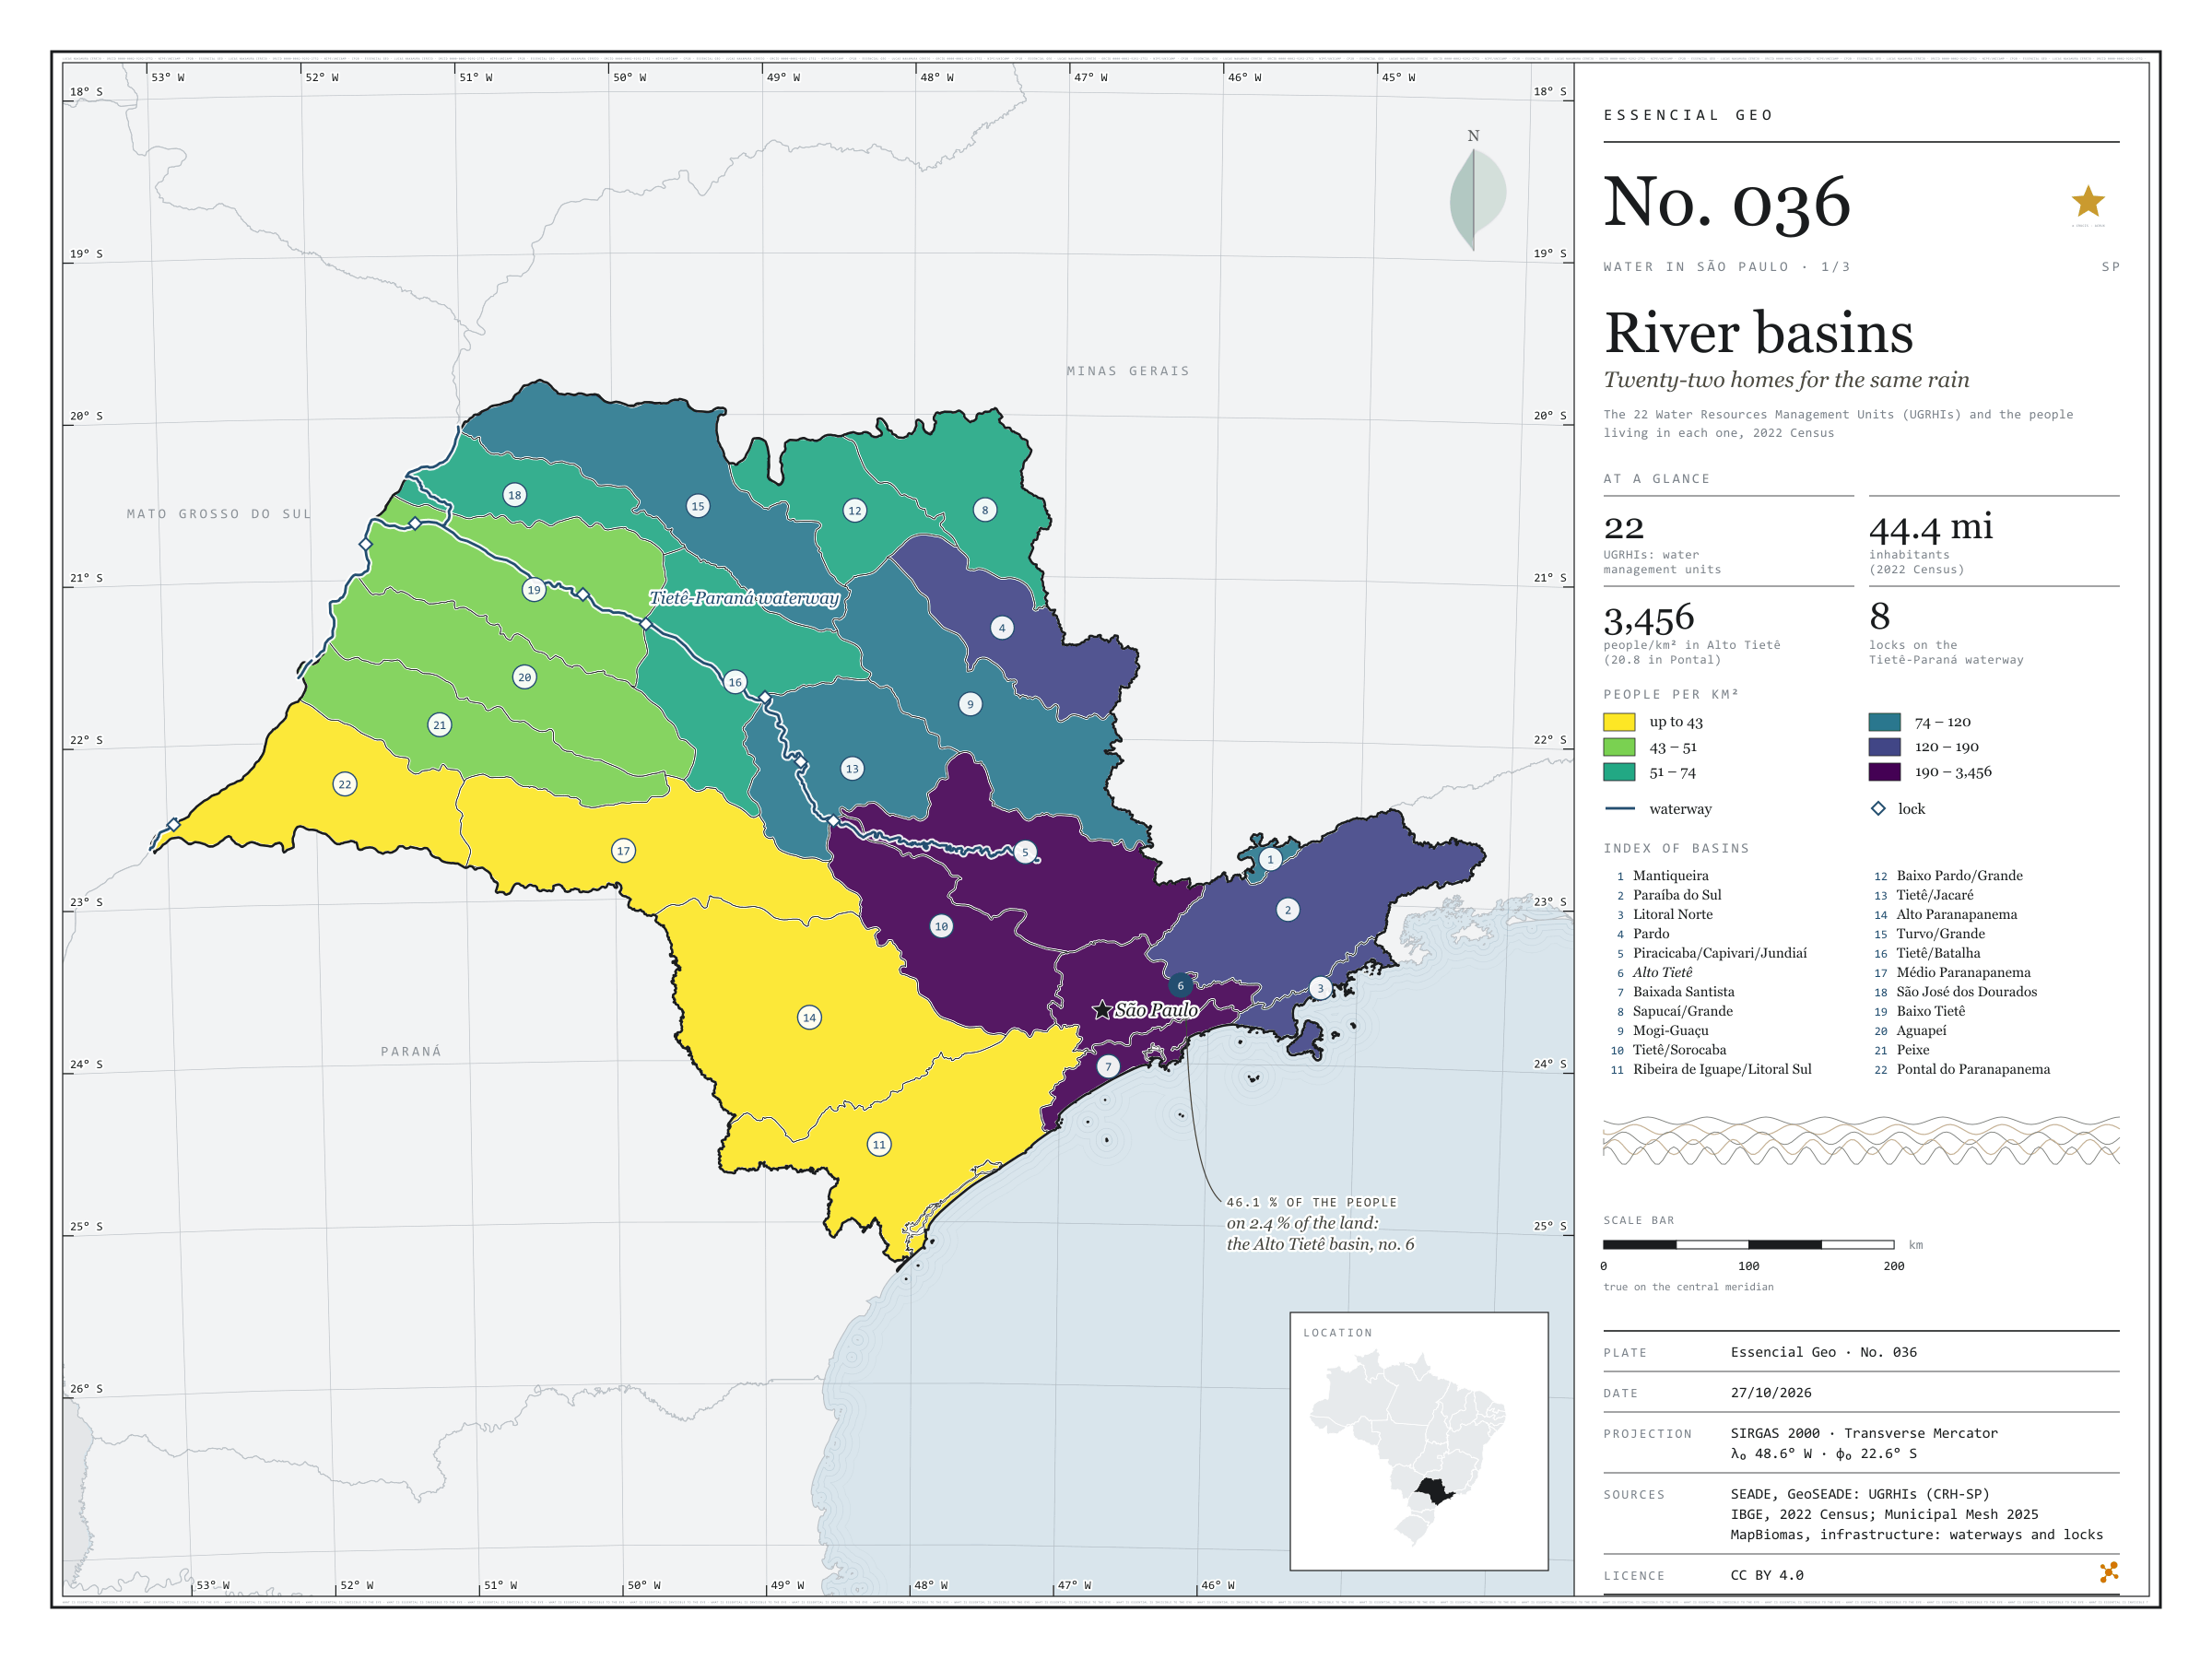
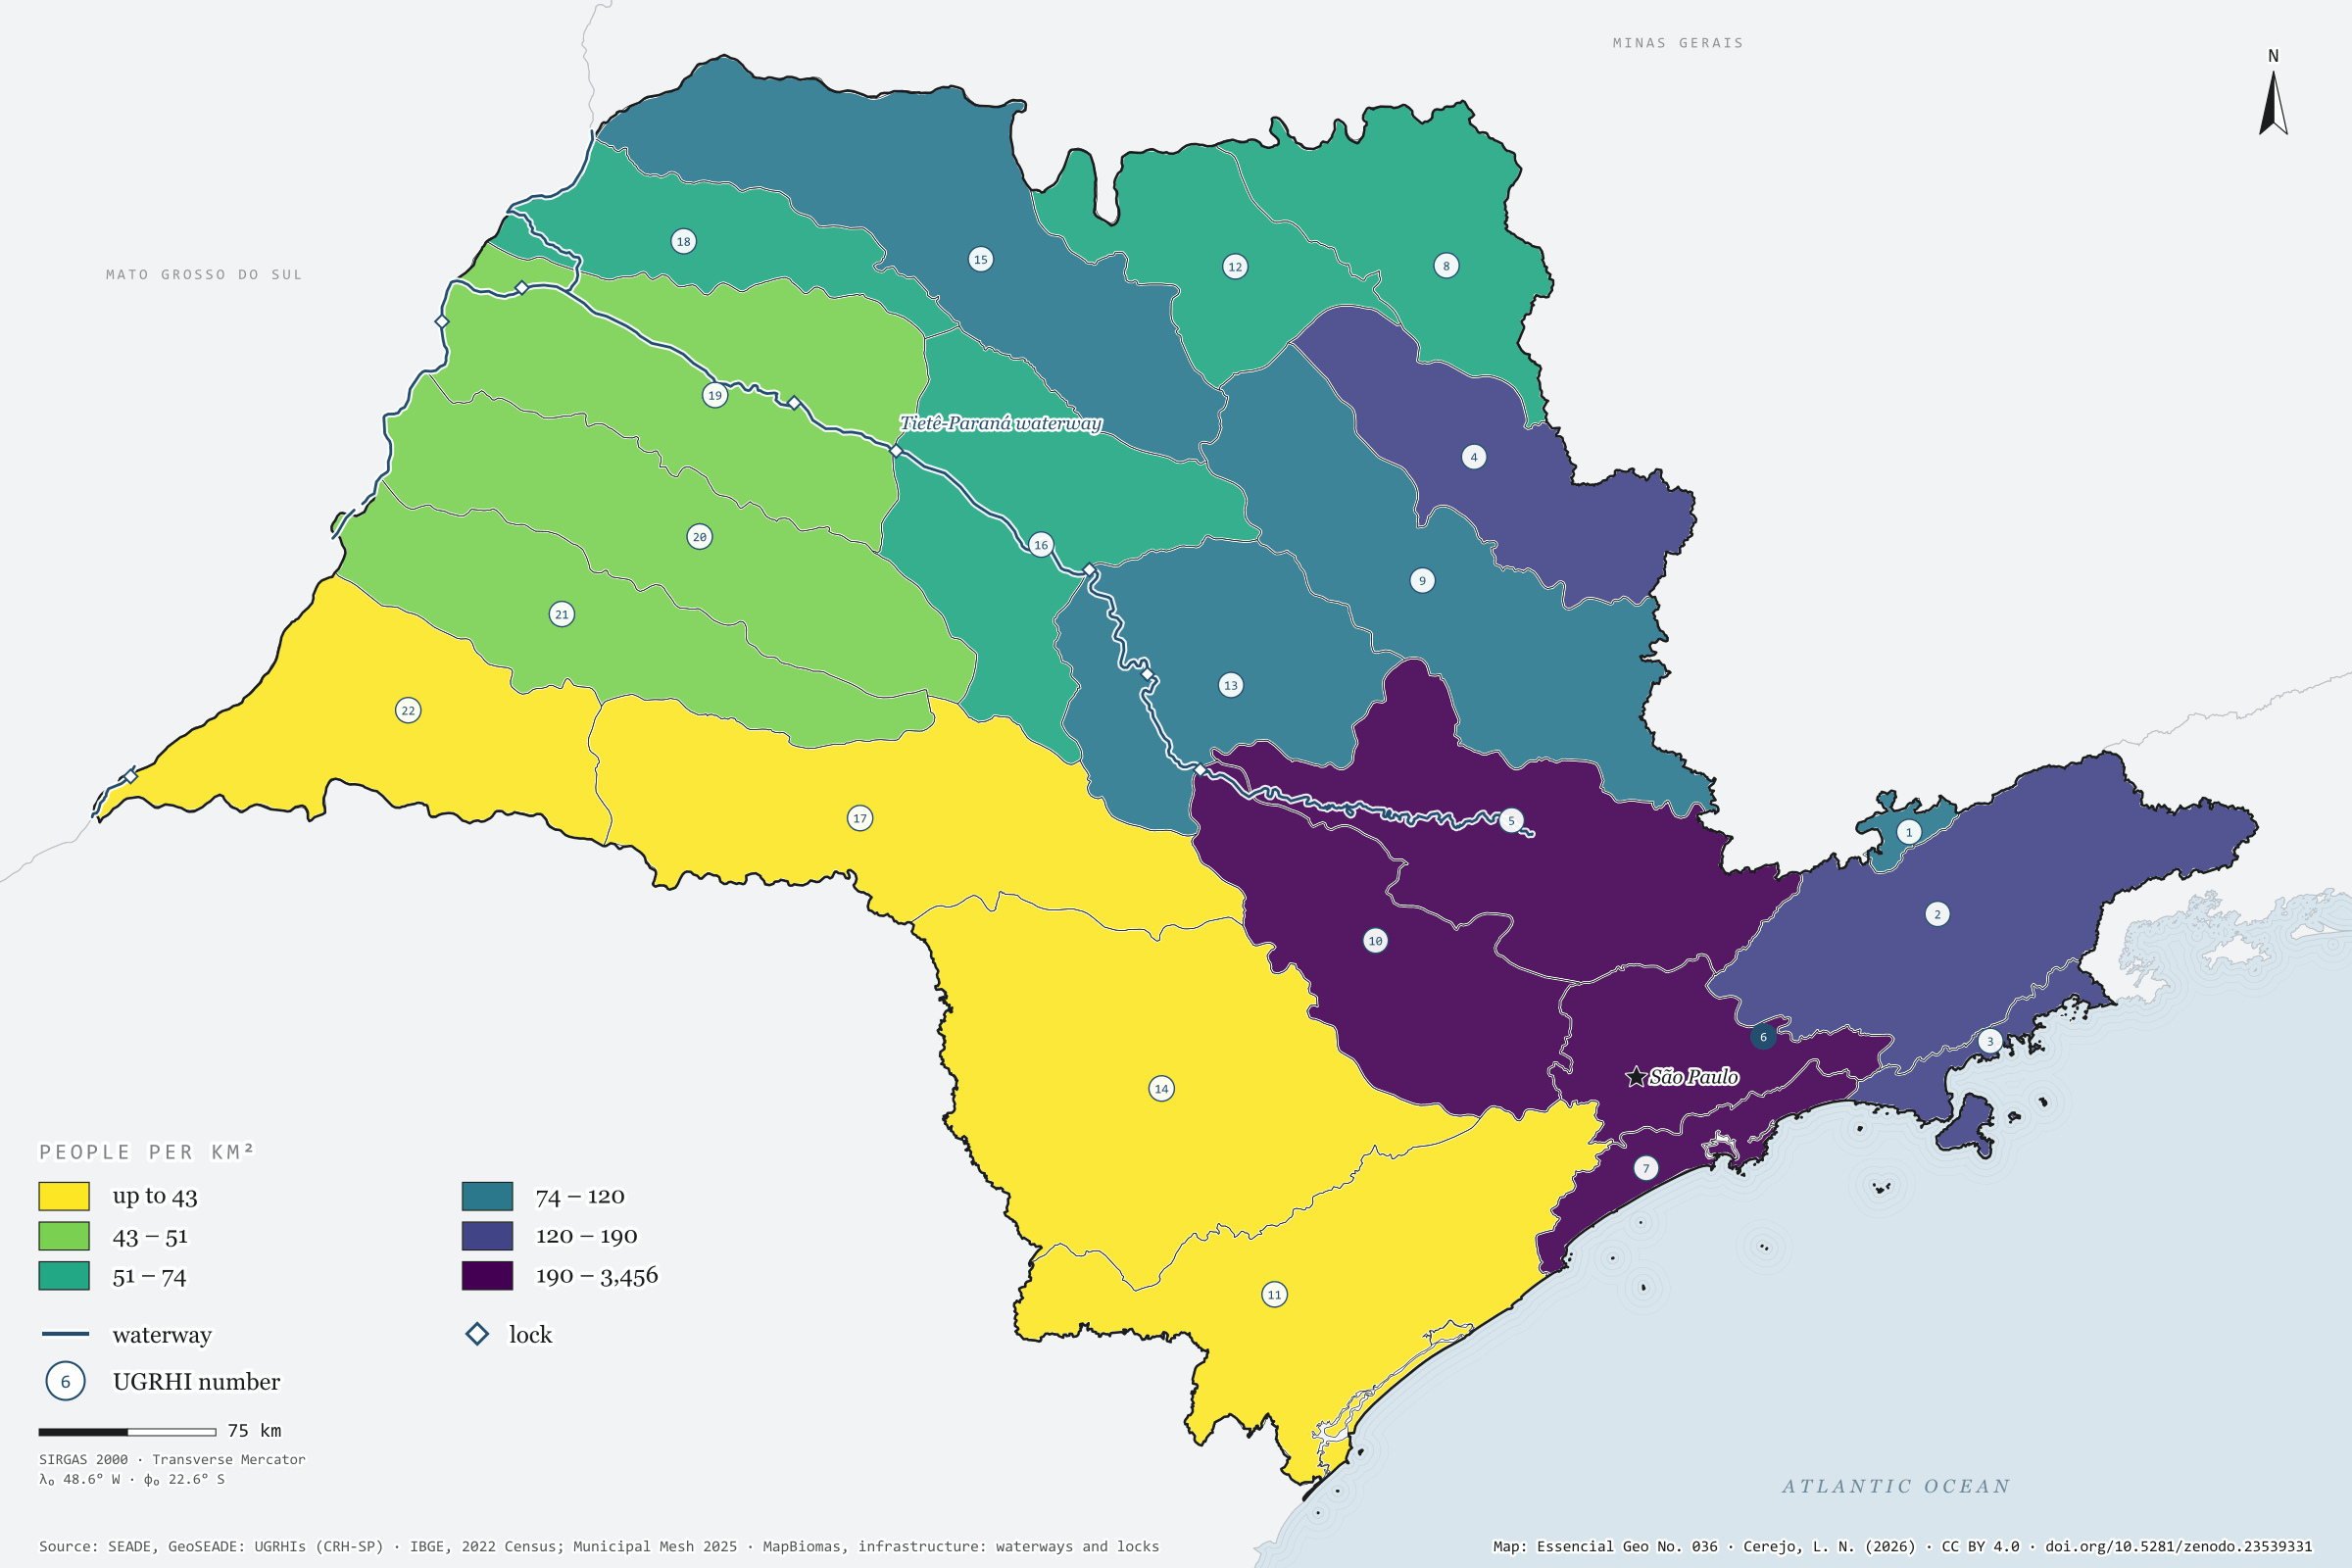
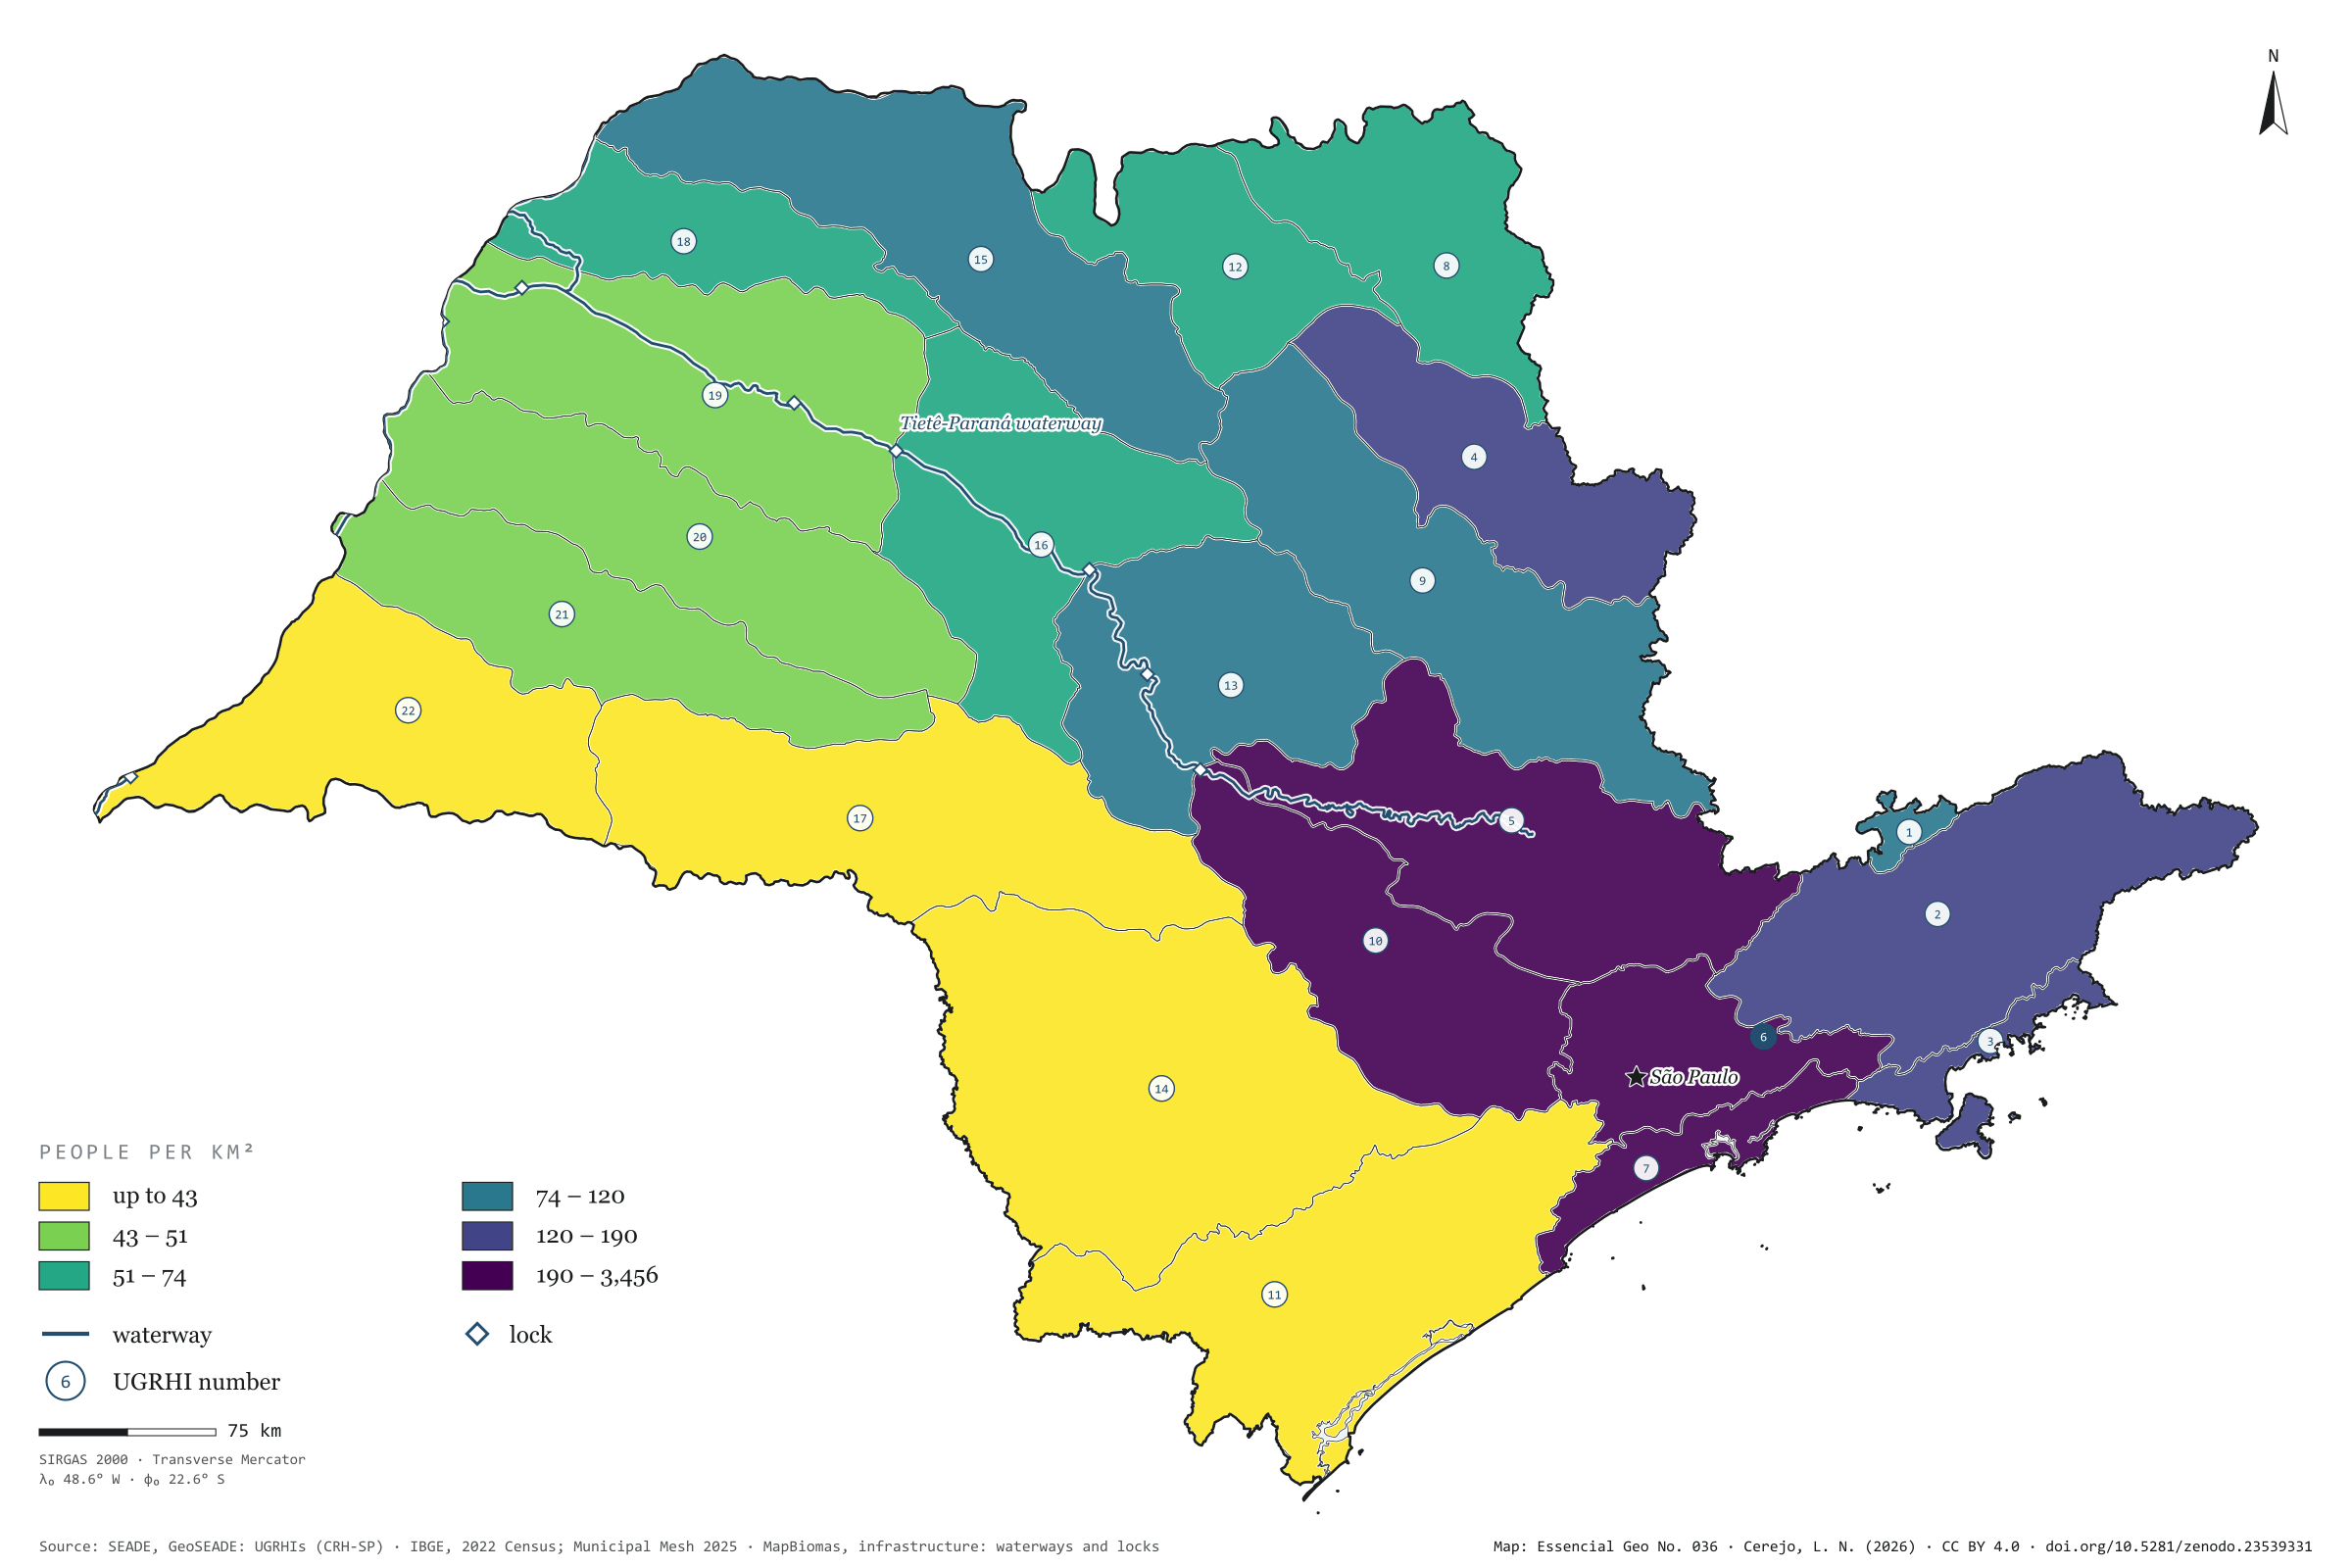
To look after its water, São Paulo does not use the map of municipalities but the map of basins: 22 Water Resources Management Units, the UGRHIs. Coloured by the 2022 Census population, they show a state that is unequal under the same rain. The municipalities of Alto Tietê, around the capital, hold 20.5 million people, 46.1% of the state’s population, on 2.4% of its land: 3,456 people per km². In Pontal do Paranapanema there are 20.8. Along the Tietê and the Paraná runs the waterway too, with its eight locks drawn on the map. First plate of the collection “Water in São Paulo”.
Technical record · downloads · citation
At a glance
Share of São Paulo’s population, by UGRHI (top five) (%)
6 · Alto Tietê46
5 · Piracicaba/Capivari/Jundiaí13
10 · Tietê/Sorocaba5.1
2 · Paraíba do Sul5.1
7 · Baixada Santista4.1
Density in Alto Tietê
3,456people/km²
In Pontal do Paranapanema: 20.8 people/km²
Layers
ugrhipolygon22 UGRHIs: area, municipalities, 2022 population and density
municipiospolygon645 municipalities, with the assigned UGRHI, the share of territory in it and the 2022 population
Each municipality assigned to the UGRHI covering most of its territory; 2022 Census population summed by UGRHI and divided by basin area, in six quantile classes.
The map without a frame, with legend, scale, reference system and credit written on it: ready for papers, lectures and slides. In two versions: with the basemap (neighbours and sea) or only the mapped area, on white.
CEREJO, Lucas Nakamura. Bacias hidrográficas: vinte e duas casas para a mesma chuva. Versão 1.0.0. [S. l.]: Zenodo, 2026. Conjunto de dados. DOI: 10.5281/zenodo.23539331. Disponível em: https://doi.org/10.5281/zenodo.23539331. Acesso em: 10 nov. 2026.
Cerejo, L. N. (2026). Bacias hidrográficas: vinte e duas casas para a mesma chuva [River basins: Twenty-two homes for the same rain] (Version 1.0.0) [Data set]. Zenodo. https://doi.org/10.5281/zenodo.23539331
@dataset{cerejo2026_bacias_hidrograficas_sp,
  author    = {Cerejo, Lucas Nakamura},
  title     = {Bacias hidrográficas: Vinte e duas casas para a mesma chuva},
  year      = {2026},
  publisher = {Zenodo},
  version   = {1.0.0},
  doi       = {10.5281/zenodo.23539331},
  url       = {https://doi.org/10.5281/zenodo.23539331},
  language  = {portuguese},
  note      = {English title: River basins: Twenty-two homes for the same rain. Licence CC BY 4.0}
}
Fig. 035Municipality of Campinas (SP)EPSG:4674Source: FBDS, IBGE
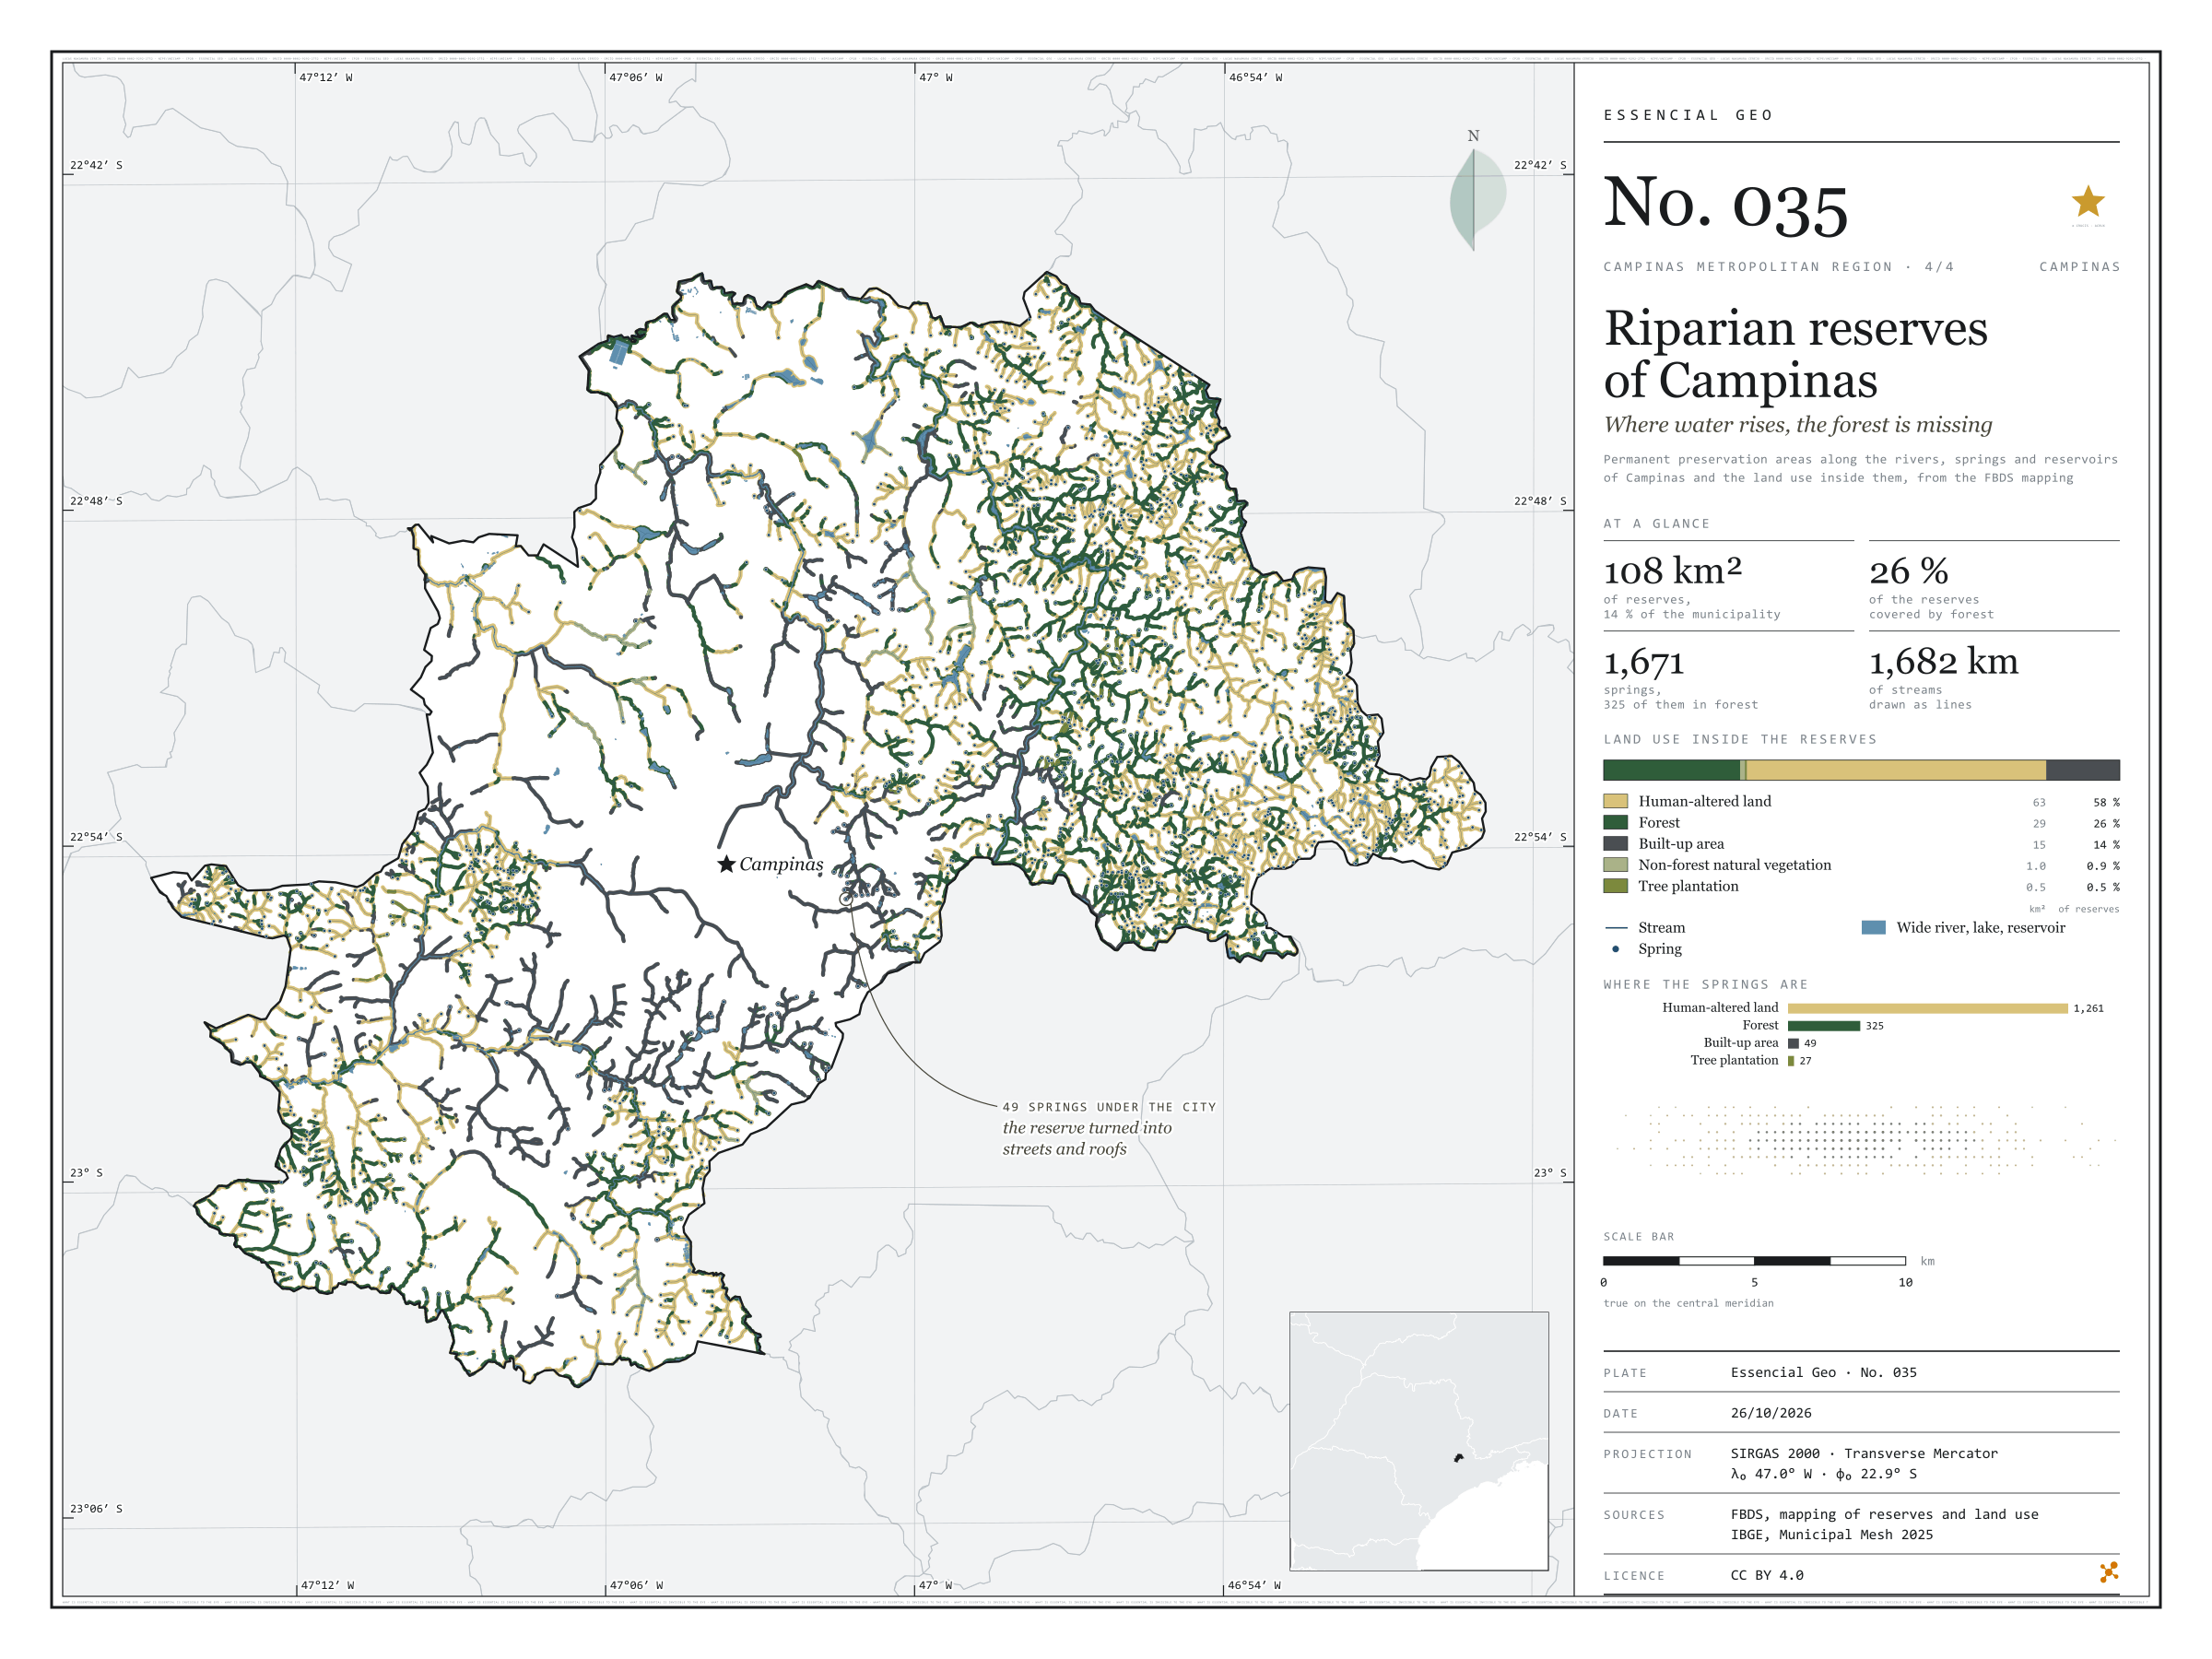
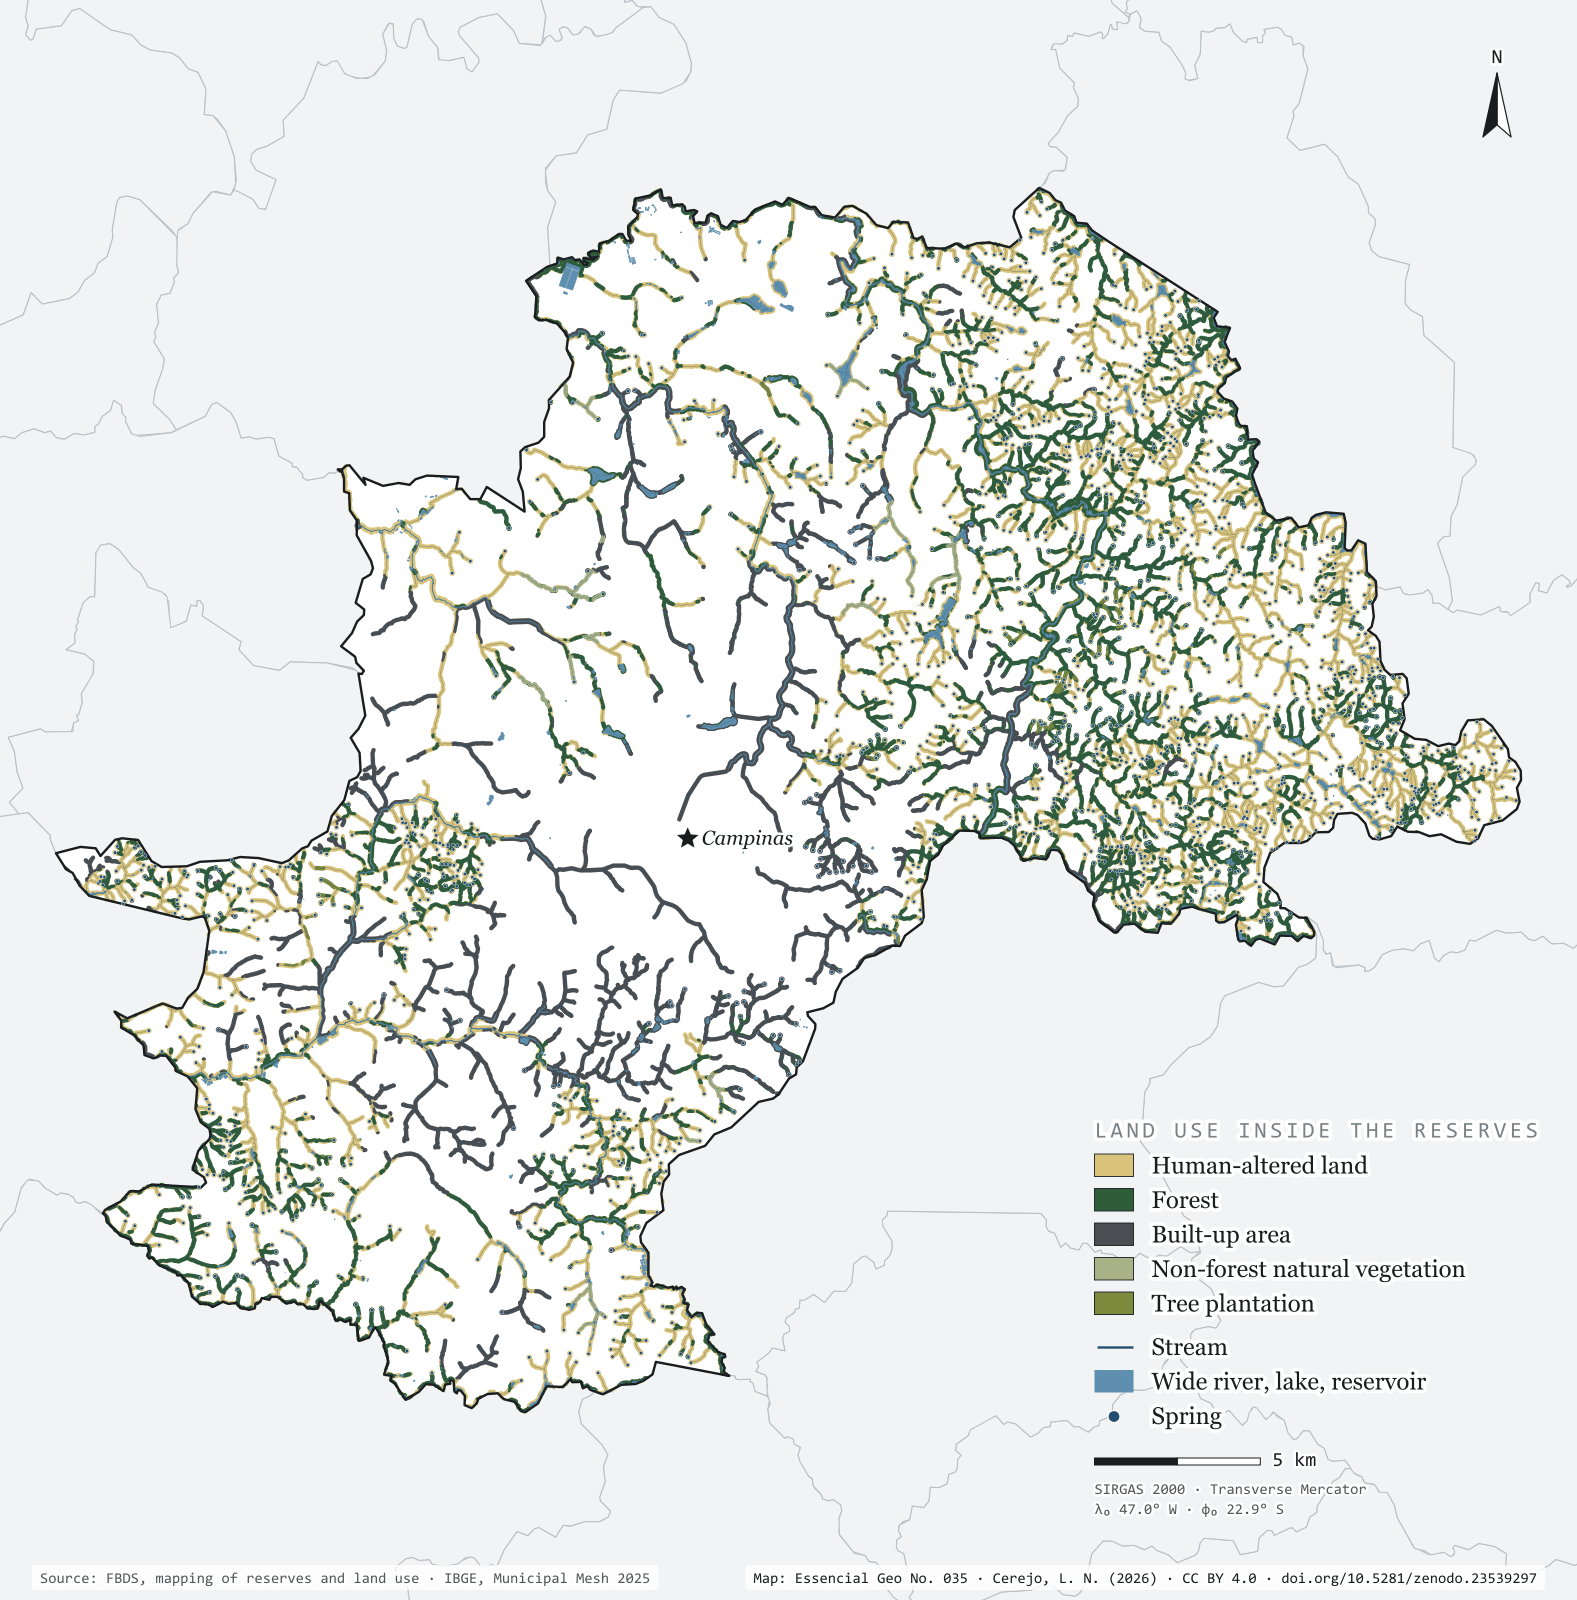
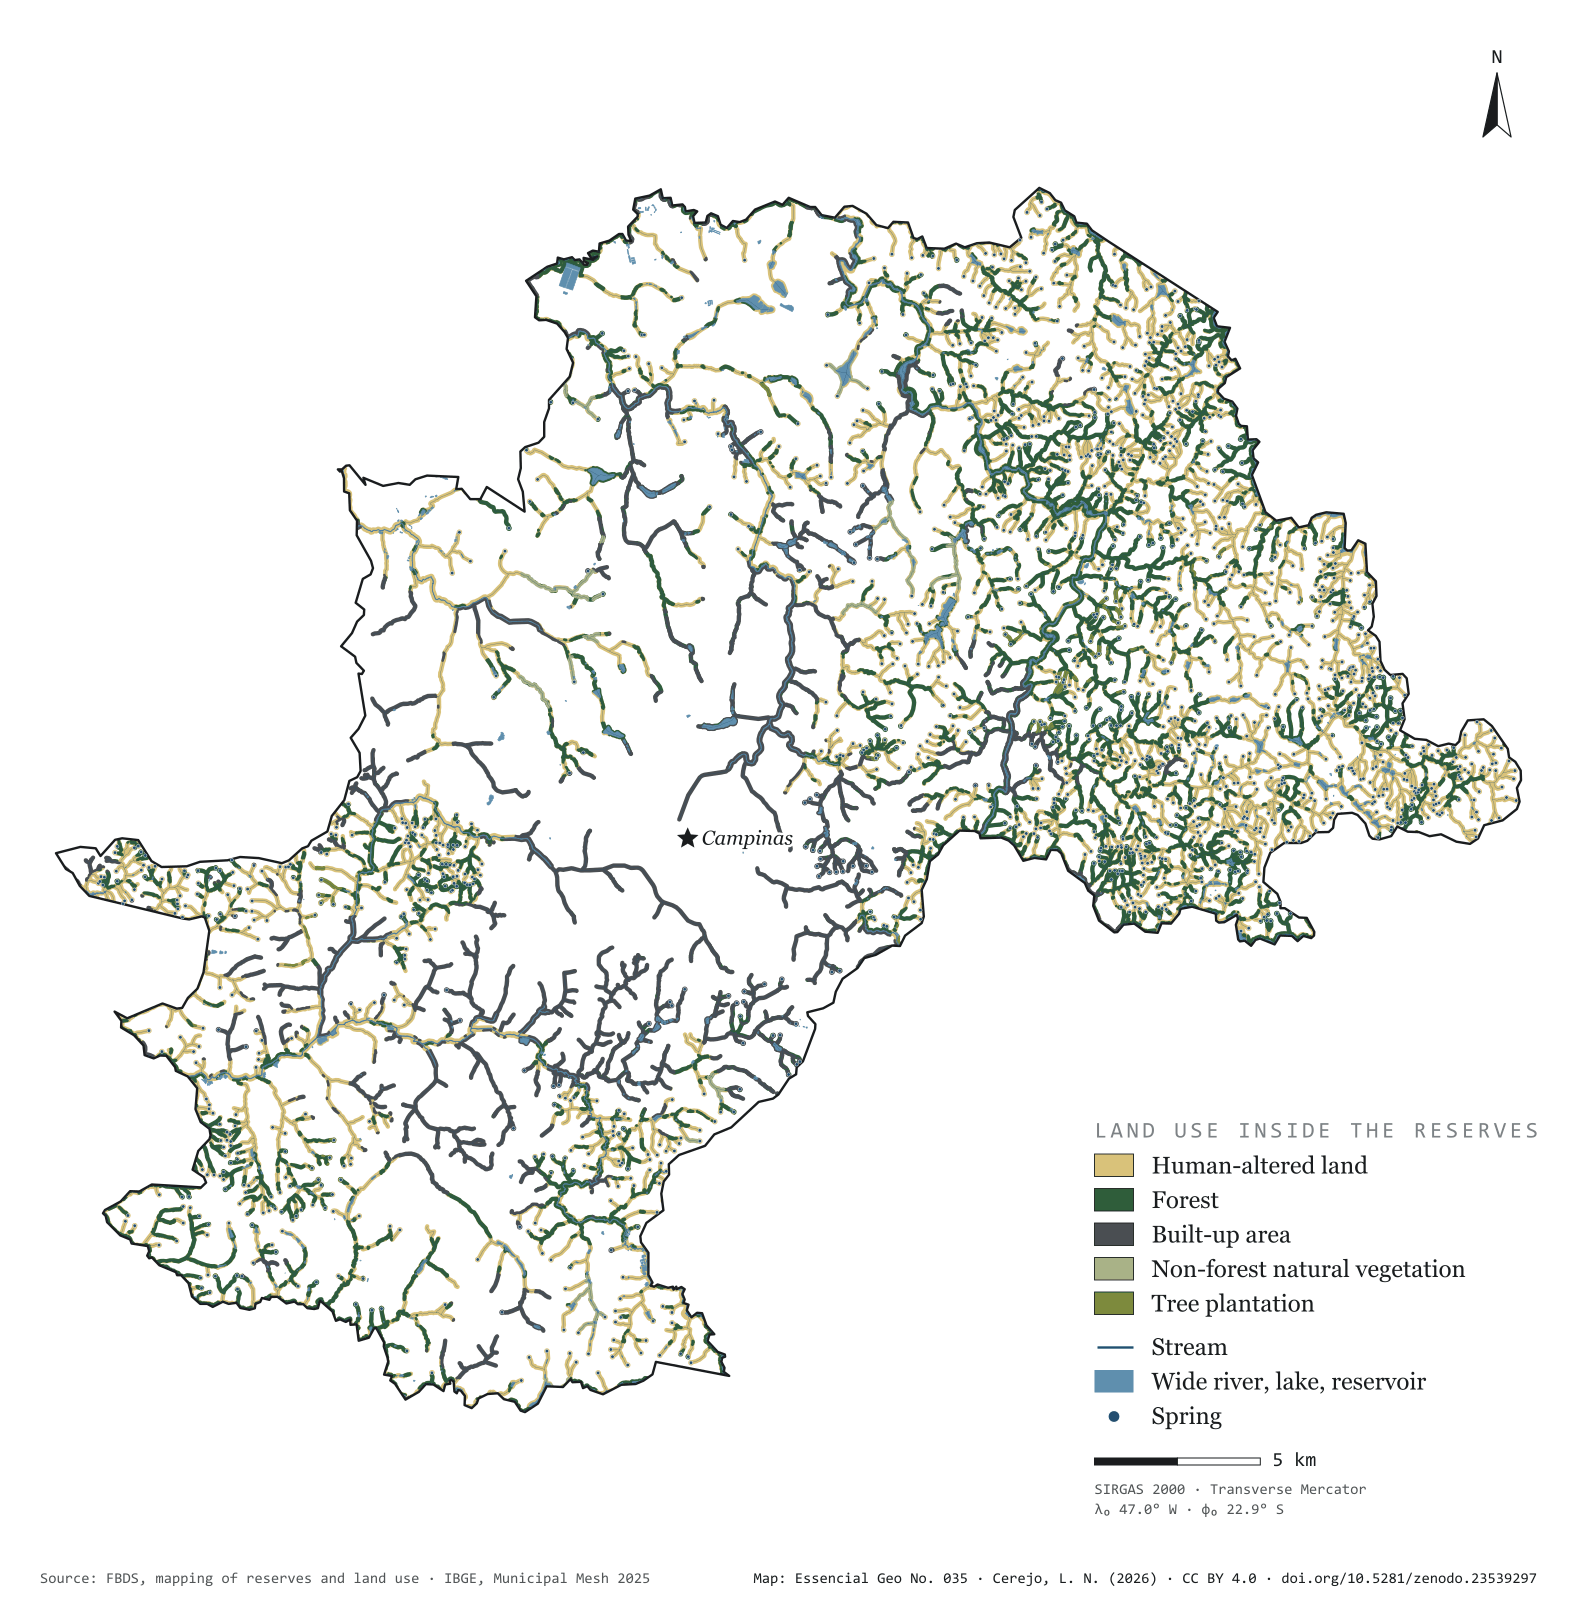
Brazil’s Forest Code requires a strip of protected vegetation along every river, around every spring and on the shores of reservoirs: the permanent preservation areas, or APPs. In Campinas they add up to 108 km², 13.6% of the municipality, drawn over 1,682 km of streams and 1,671 springs. Only 26.4% of that strip is forest. The rest is pasture, cropland and bare soil (57.9%) or city (14.3%). Of the springs, 325 lie in forest and 1,261 in human-altered land; 49 have ended up under the streets and roofs of the urban area. On the map, green thickens in the east, in the hills of Sousas and Joaquim Egídio, and vanishes in the centre, where the streams run between houses. Fourth plate of the collection “Campinas Metropolitan Region”.
Technical record · downloads · citation
At a glance
Land use inside the reserves (km²) (km²)
Área antropizada57.9%
Formação florestal26.4%
Área edificada14.3%
Formação não florestal0.9%
Silvicultura0.5%
Springs, by the land use class they fall in (springs)
Área antropizada1,261
Formação florestal325
Área edificada49
Silvicultura27
Reserve area covered by forest
26%
28.6 of the municipality’s 108.1 km² of reserves
Layers
app_usopolygonLand use inside the reserves, in five classes, with area in hectares
apppolygon2,657 reserve strips, with their origin (stream, water body, spring) and width in metres
riosline5,351 single-line stream segments, with width class and length
rios_duplospolygon114 double-bank river reaches
massas_daguapolygon967 lakes and reservoirs, 956 of them artificial
Reserves, stream network, springs and land use inside the reserves from the FBDS mapping of Campinas; area of each land use class summed and springs assigned to the class they fall in.
The map without a frame, with legend, scale, reference system and credit written on it: ready for papers, lectures and slides. In two versions: with the basemap (neighbours and sea) or only the mapped area, on white.
CEREJO, Lucas Nakamura. APPs de Campinas: onde a água nasce, a mata falta. Versão 1.0.0. [S. l.]: Zenodo, 2026. Conjunto de dados. DOI: 10.5281/zenodo.23539297. Disponível em: https://doi.org/10.5281/zenodo.23539297. Acesso em: 10 nov. 2026.
Cerejo, L. N. (2026). APPs de Campinas: onde a água nasce, a mata falta [Riparian reserves of Campinas: Where water rises, the forest is missing] (Version 1.0.0) [Data set]. Zenodo. https://doi.org/10.5281/zenodo.23539297
@dataset{cerejo2026_apps_campinas,
  author    = {Cerejo, Lucas Nakamura},
  title     = {APPs de Campinas: Onde a água nasce, a mata falta},
  year      = {2026},
  publisher = {Zenodo},
  version   = {1.0.0},
  doi       = {10.5281/zenodo.23539297},
  url       = {https://doi.org/10.5281/zenodo.23539297},
  language  = {portuguese},
  note      = {English title: Riparian reserves of Campinas: Where water rises, the forest is missing. Licence CC BY 4.0}
}
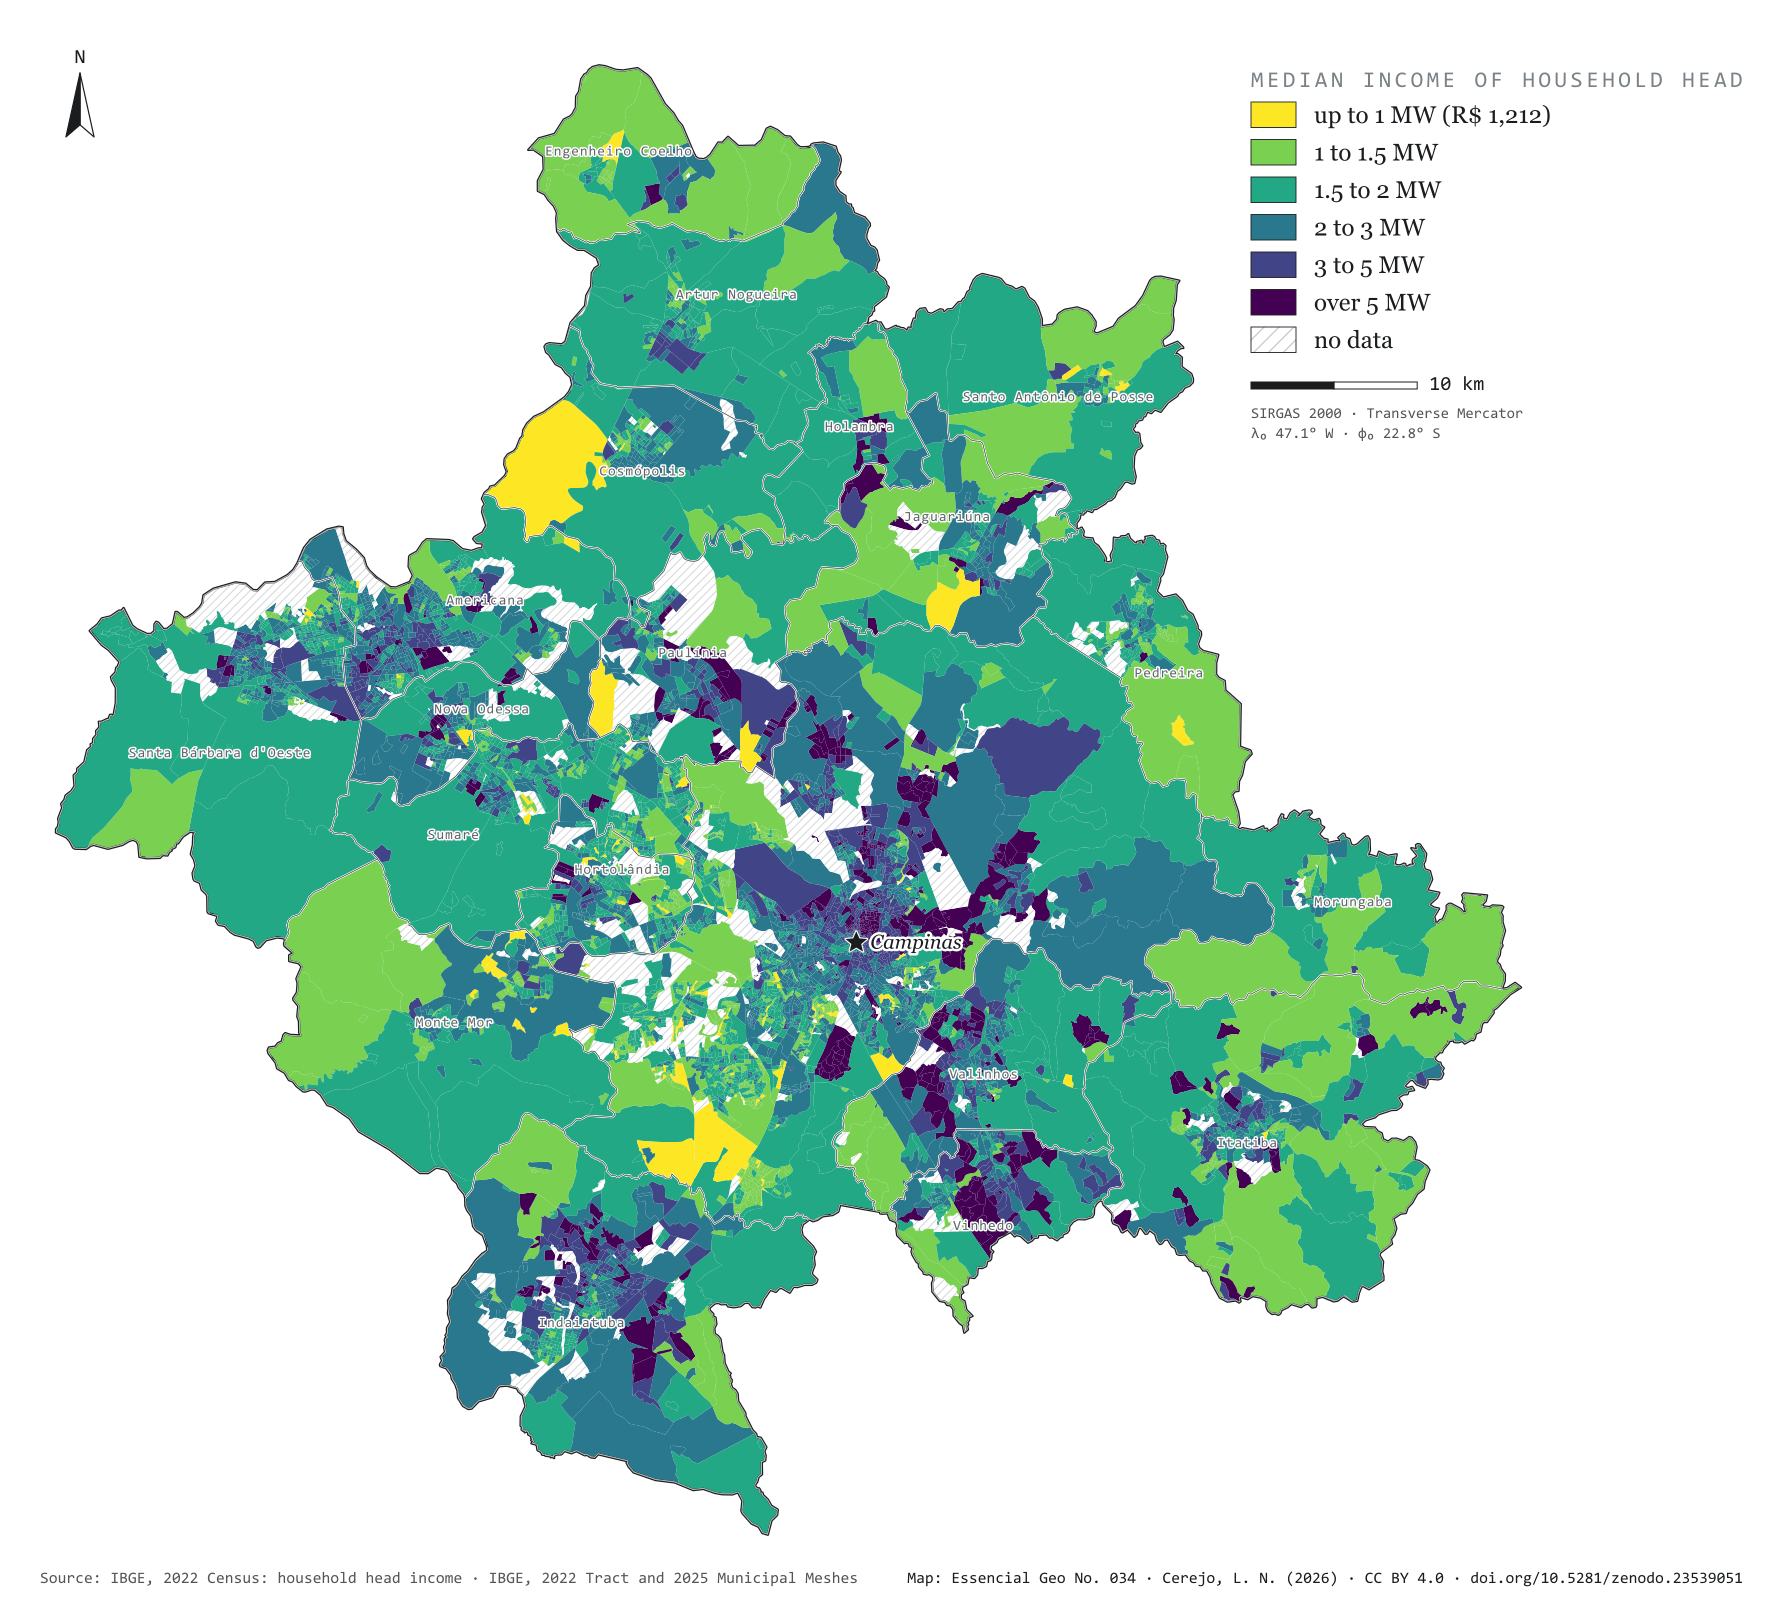
Fig. 034Campinas Metropolitan Region (SP)EPSG:4674Source: IBGE
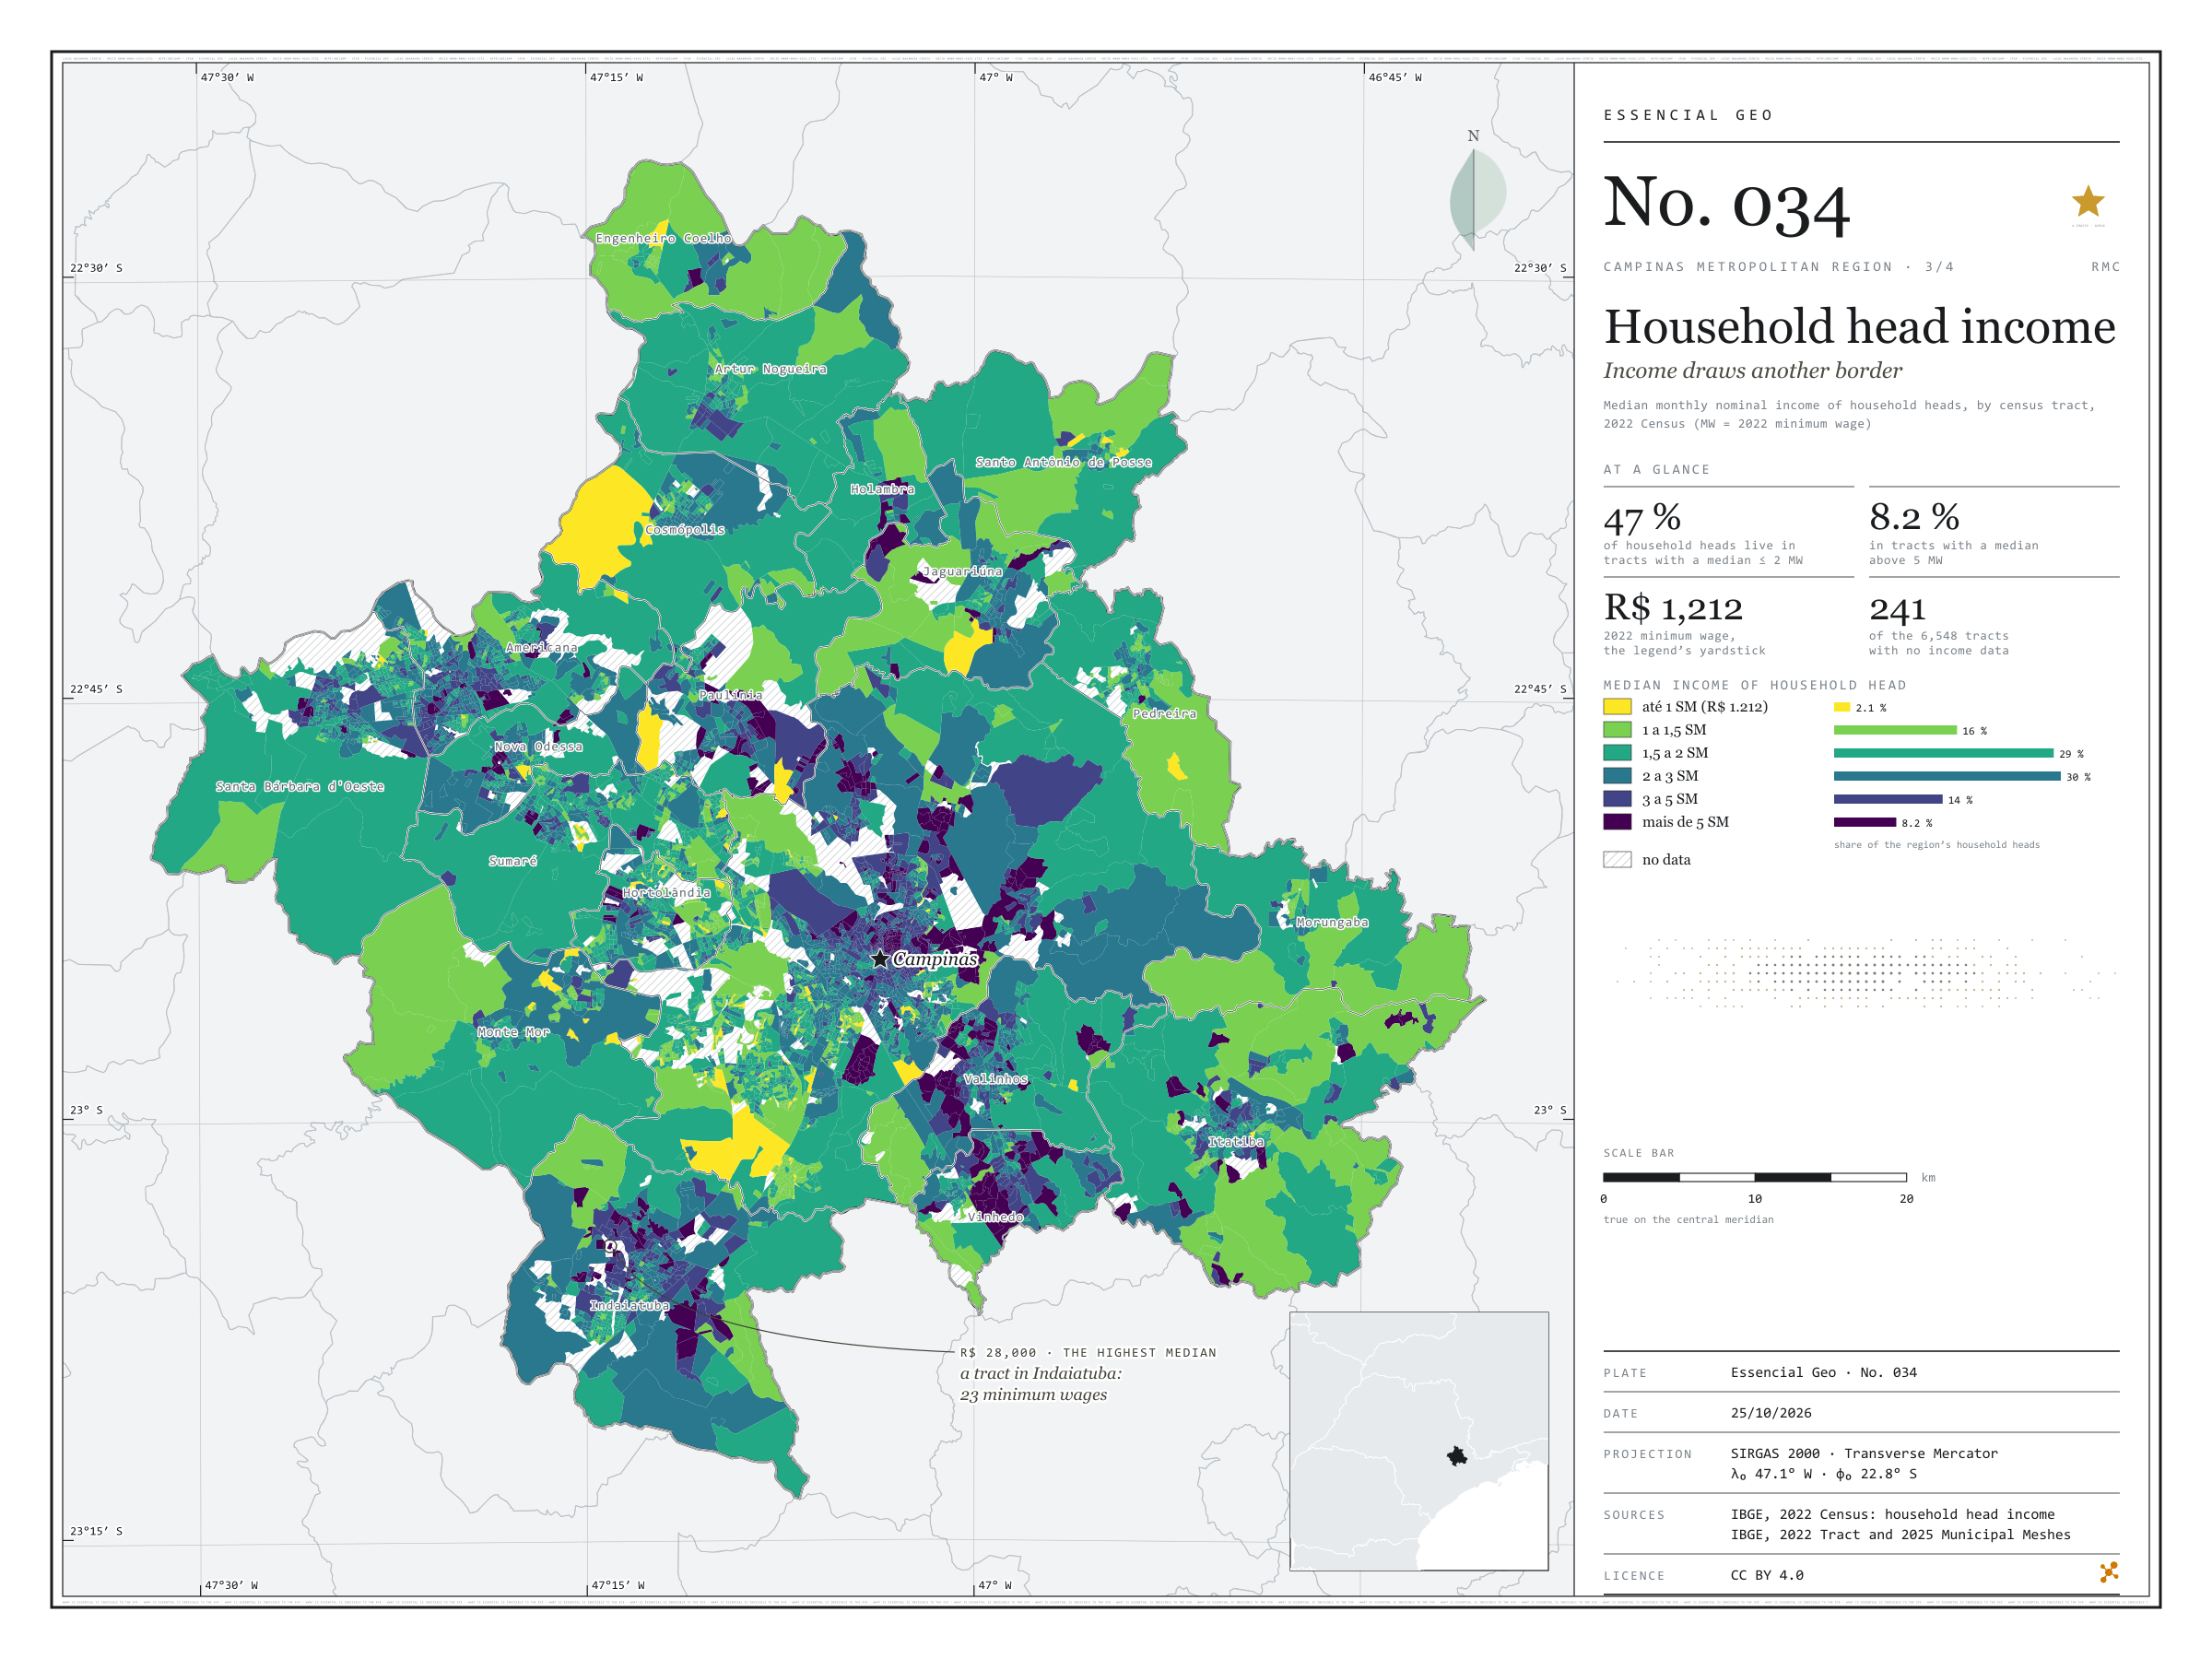
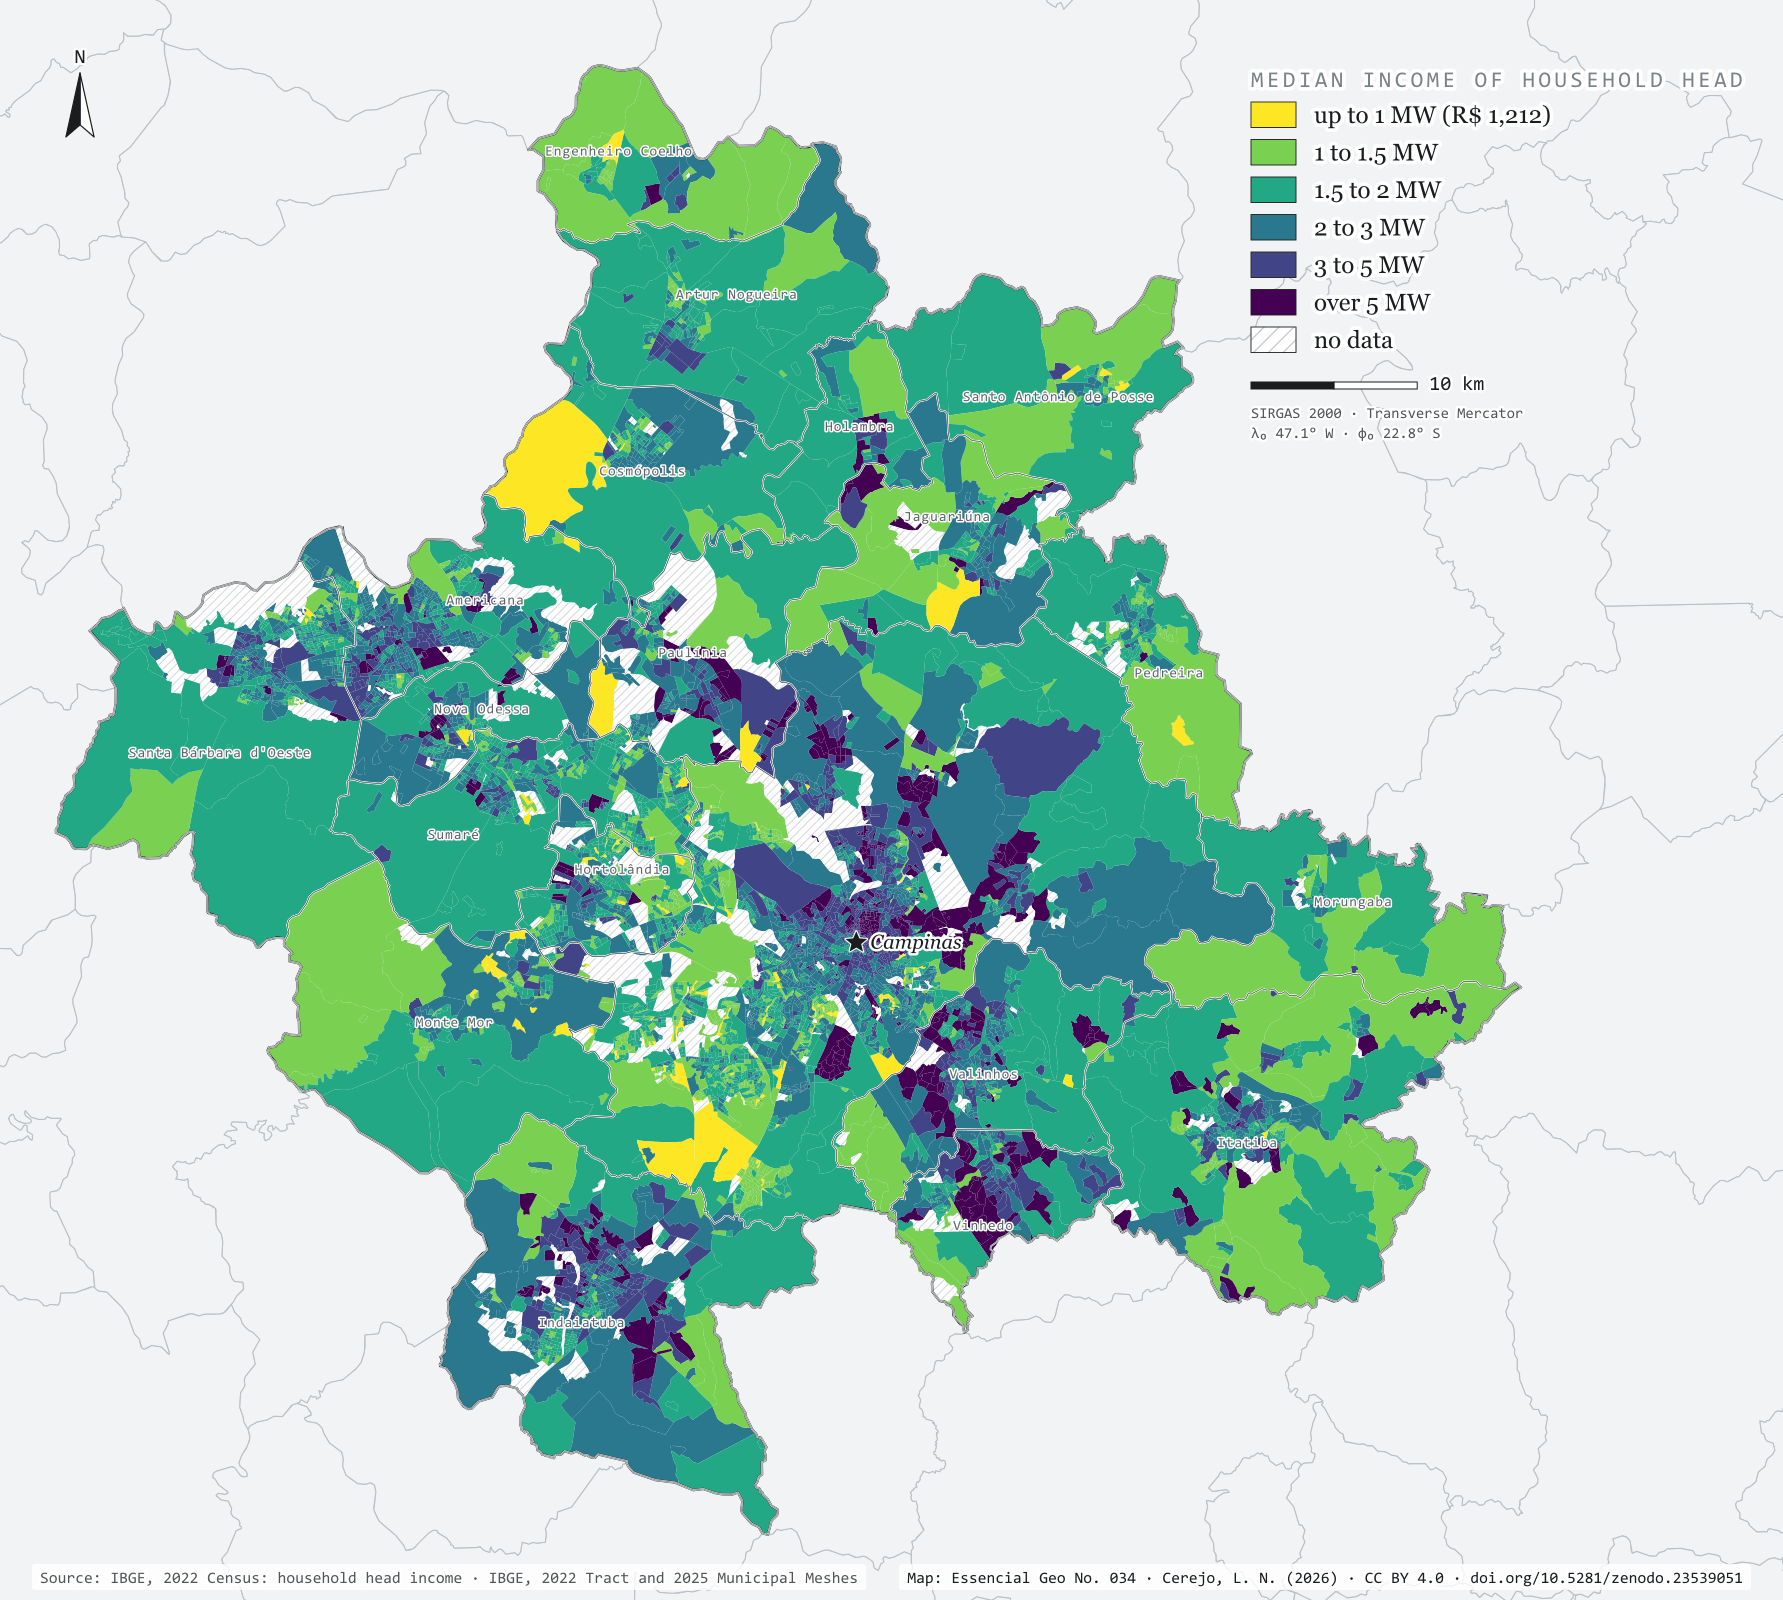
In 2022, the Brazilian minimum wage was R$ 1,212 a month. In the Campinas Metropolitan Region, 47% of household heads lived in census tracts where the heads’ median income did not exceed two minimum wages; 8.2% lived in tracts above five. The map colours each tract by median income and draws a border that is not the municipal one: in Vinhedo, Valinhos and Indaiatuba, one head in three lives in tracts above three minimum wages; in Hortolândia and Sumaré, one in ten; in Monte Mor, under 3%. The highest median, R$ 28,000 (23 minimum wages), belongs to a tract in Indaiatuba. Third plate of the collection “Campinas Metropolitan Region”.
Technical record · downloads · citation
At a glance
Household heads, by the tract’s median income (minimum wages) (people)
até 1 SM2.1%
1 a 1,5 SM16.3%
1,5 a 2 SM29%
2 a 3 SM30%
3 a 5 SM14.4%
mais de 5 SM8.2%
Household heads in tracts with a median of up to 2 minimum wages
47%
548,714 of the 1,156,822 heads in tracts with data
Highest tract median income
28,000R$
In Indaiatuba: 23 minimum wages
Layers
setorespolygon6,548 census tracts: household heads, residents, mean and median household head income
The map without a frame, with legend, scale, reference system and credit written on it: ready for papers, lectures and slides. In two versions: with the basemap (neighbours and sea) or only the mapped area, on white.
CEREJO, Lucas Nakamura. Renda do responsável: a renda desenha outra fronteira. Versão 1.0.0. [S. l.]: Zenodo, 2026. Conjunto de dados. DOI: 10.5281/zenodo.23539051. Disponível em: https://doi.org/10.5281/zenodo.23539051. Acesso em: 10 nov. 2026.
Cerejo, L. N. (2026). Renda do responsável: a renda desenha outra fronteira [Household head income: Income draws another border] (Version 1.0.0) [Data set]. Zenodo. https://doi.org/10.5281/zenodo.23539051
@dataset{cerejo2026_renda_rmc,
  author    = {Cerejo, Lucas Nakamura},
  title     = {Renda do responsável: A renda desenha outra fronteira},
  year      = {2026},
  publisher = {Zenodo},
  version   = {1.0.0},
  doi       = {10.5281/zenodo.23539051},
  url       = {https://doi.org/10.5281/zenodo.23539051},
  language  = {portuguese},
  note      = {English title: Household head income: Income draws another border. Licence CC BY 4.0}
}
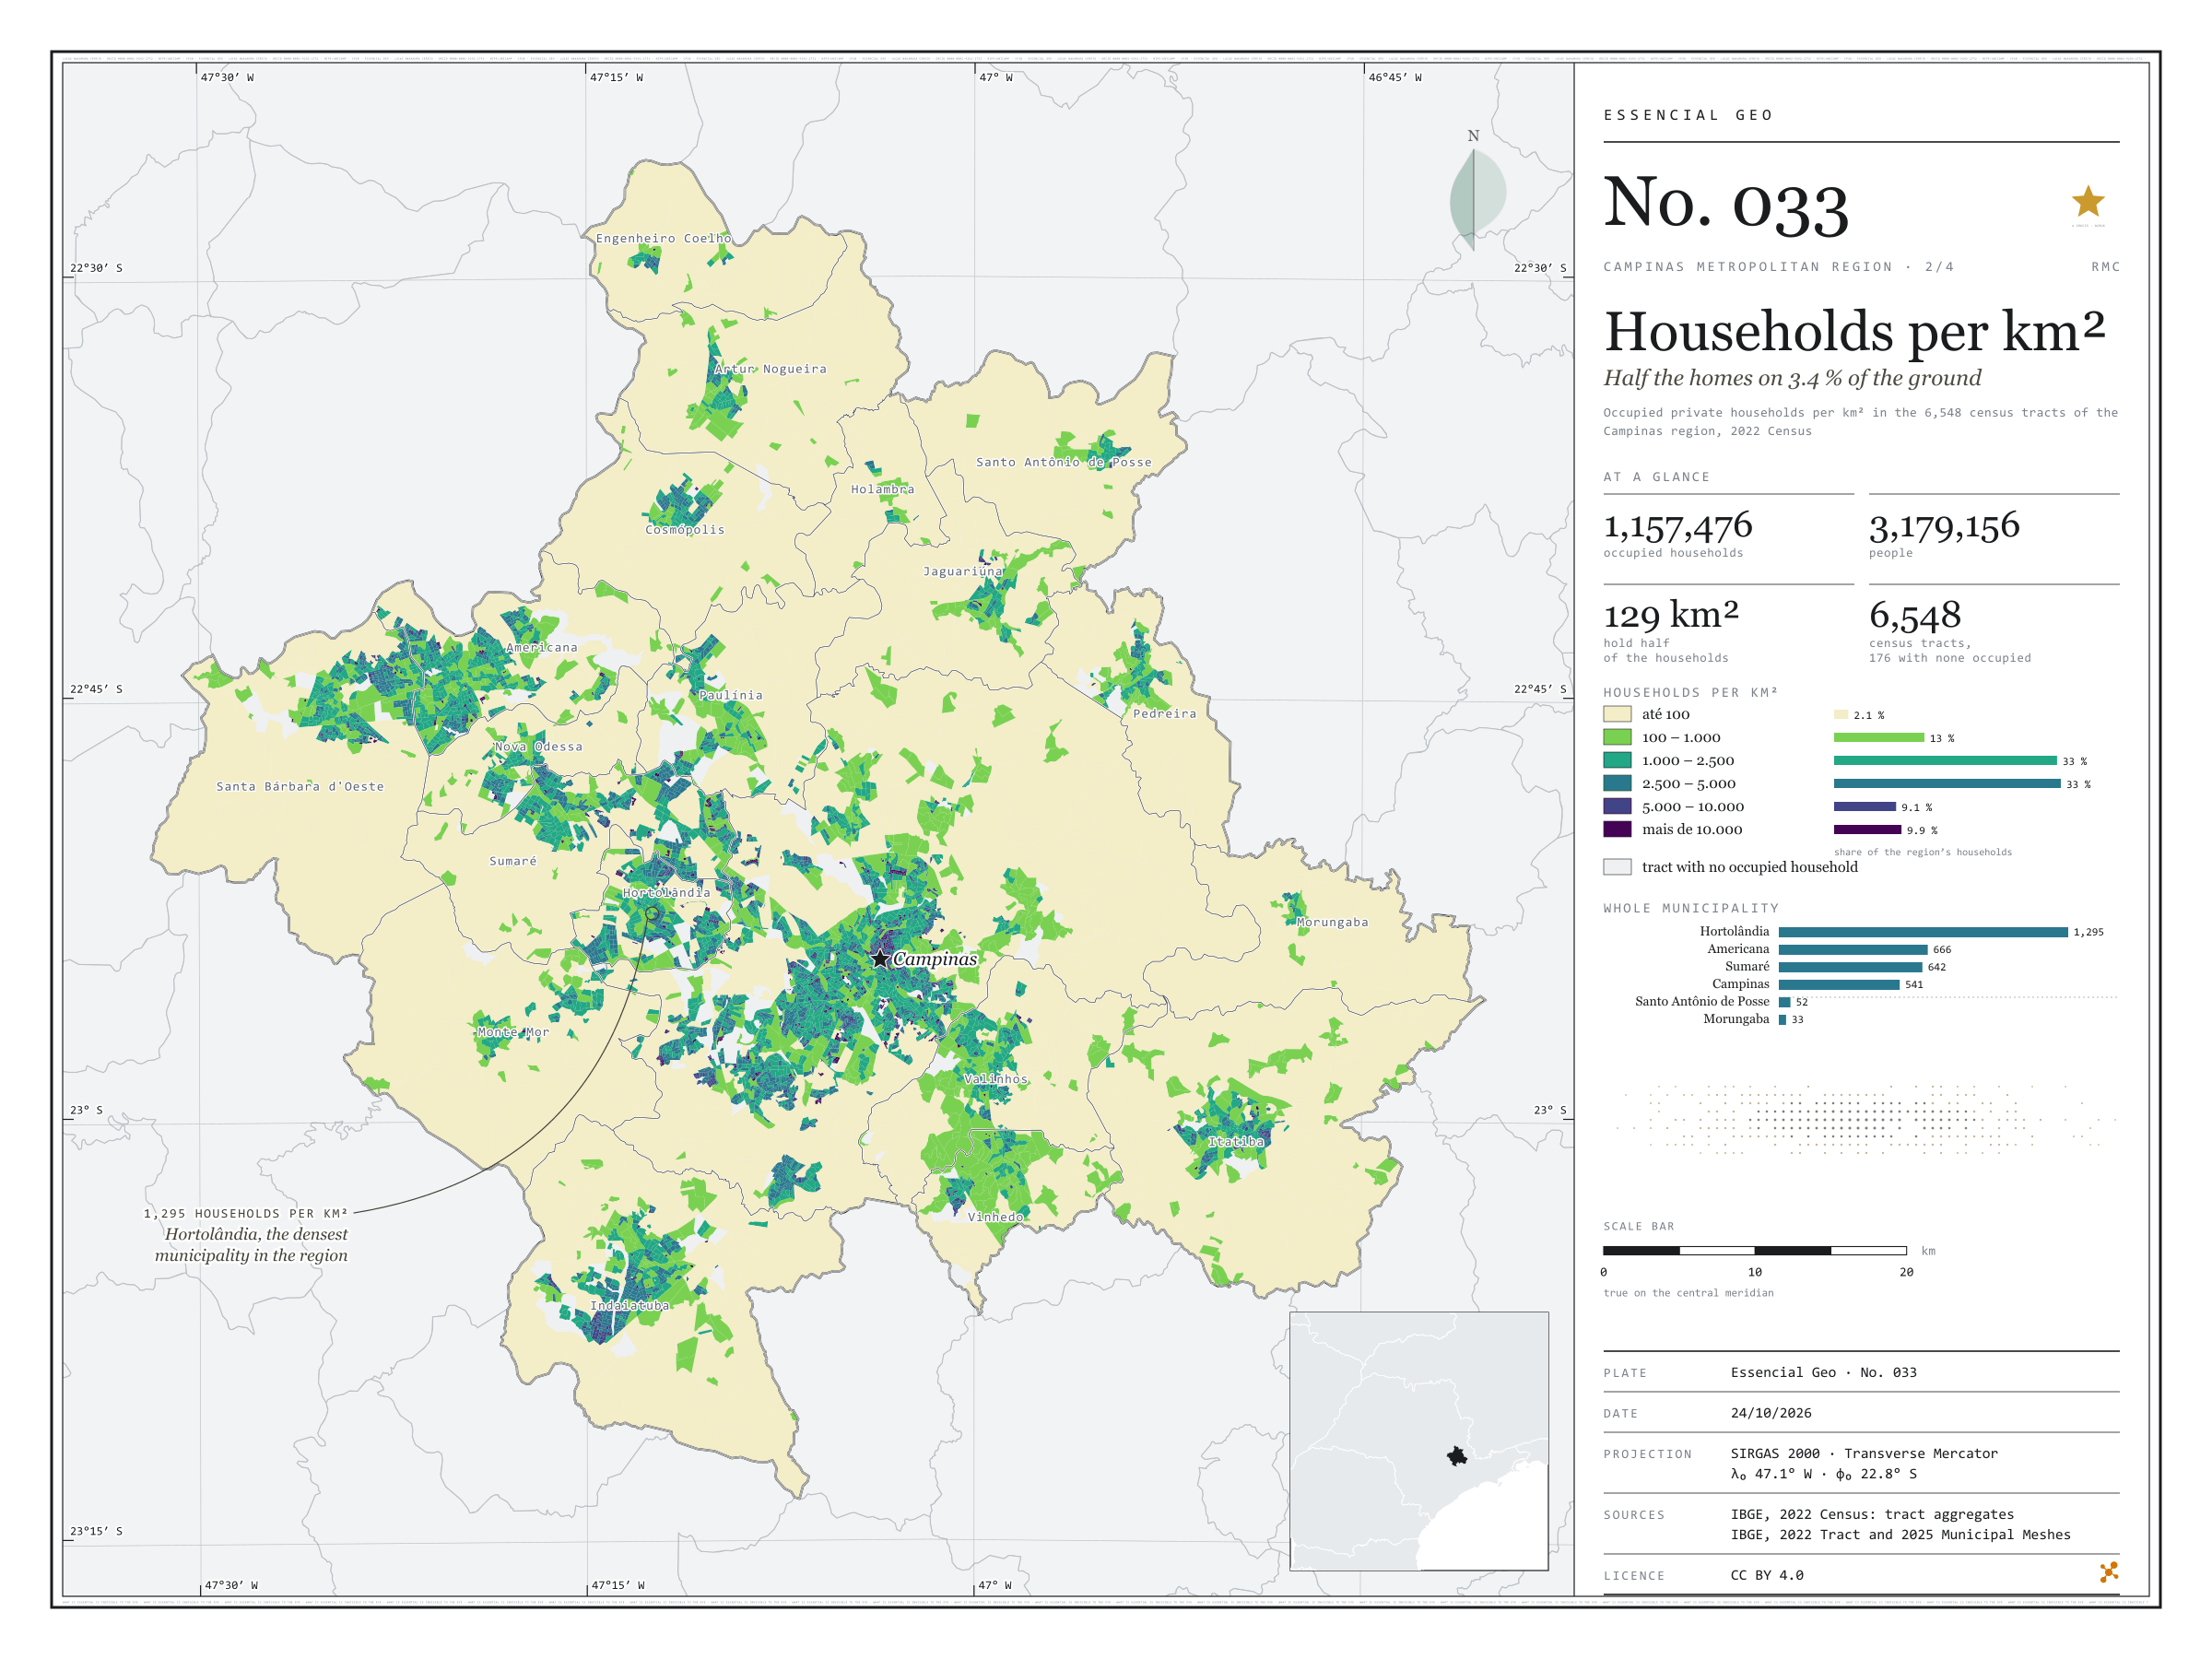
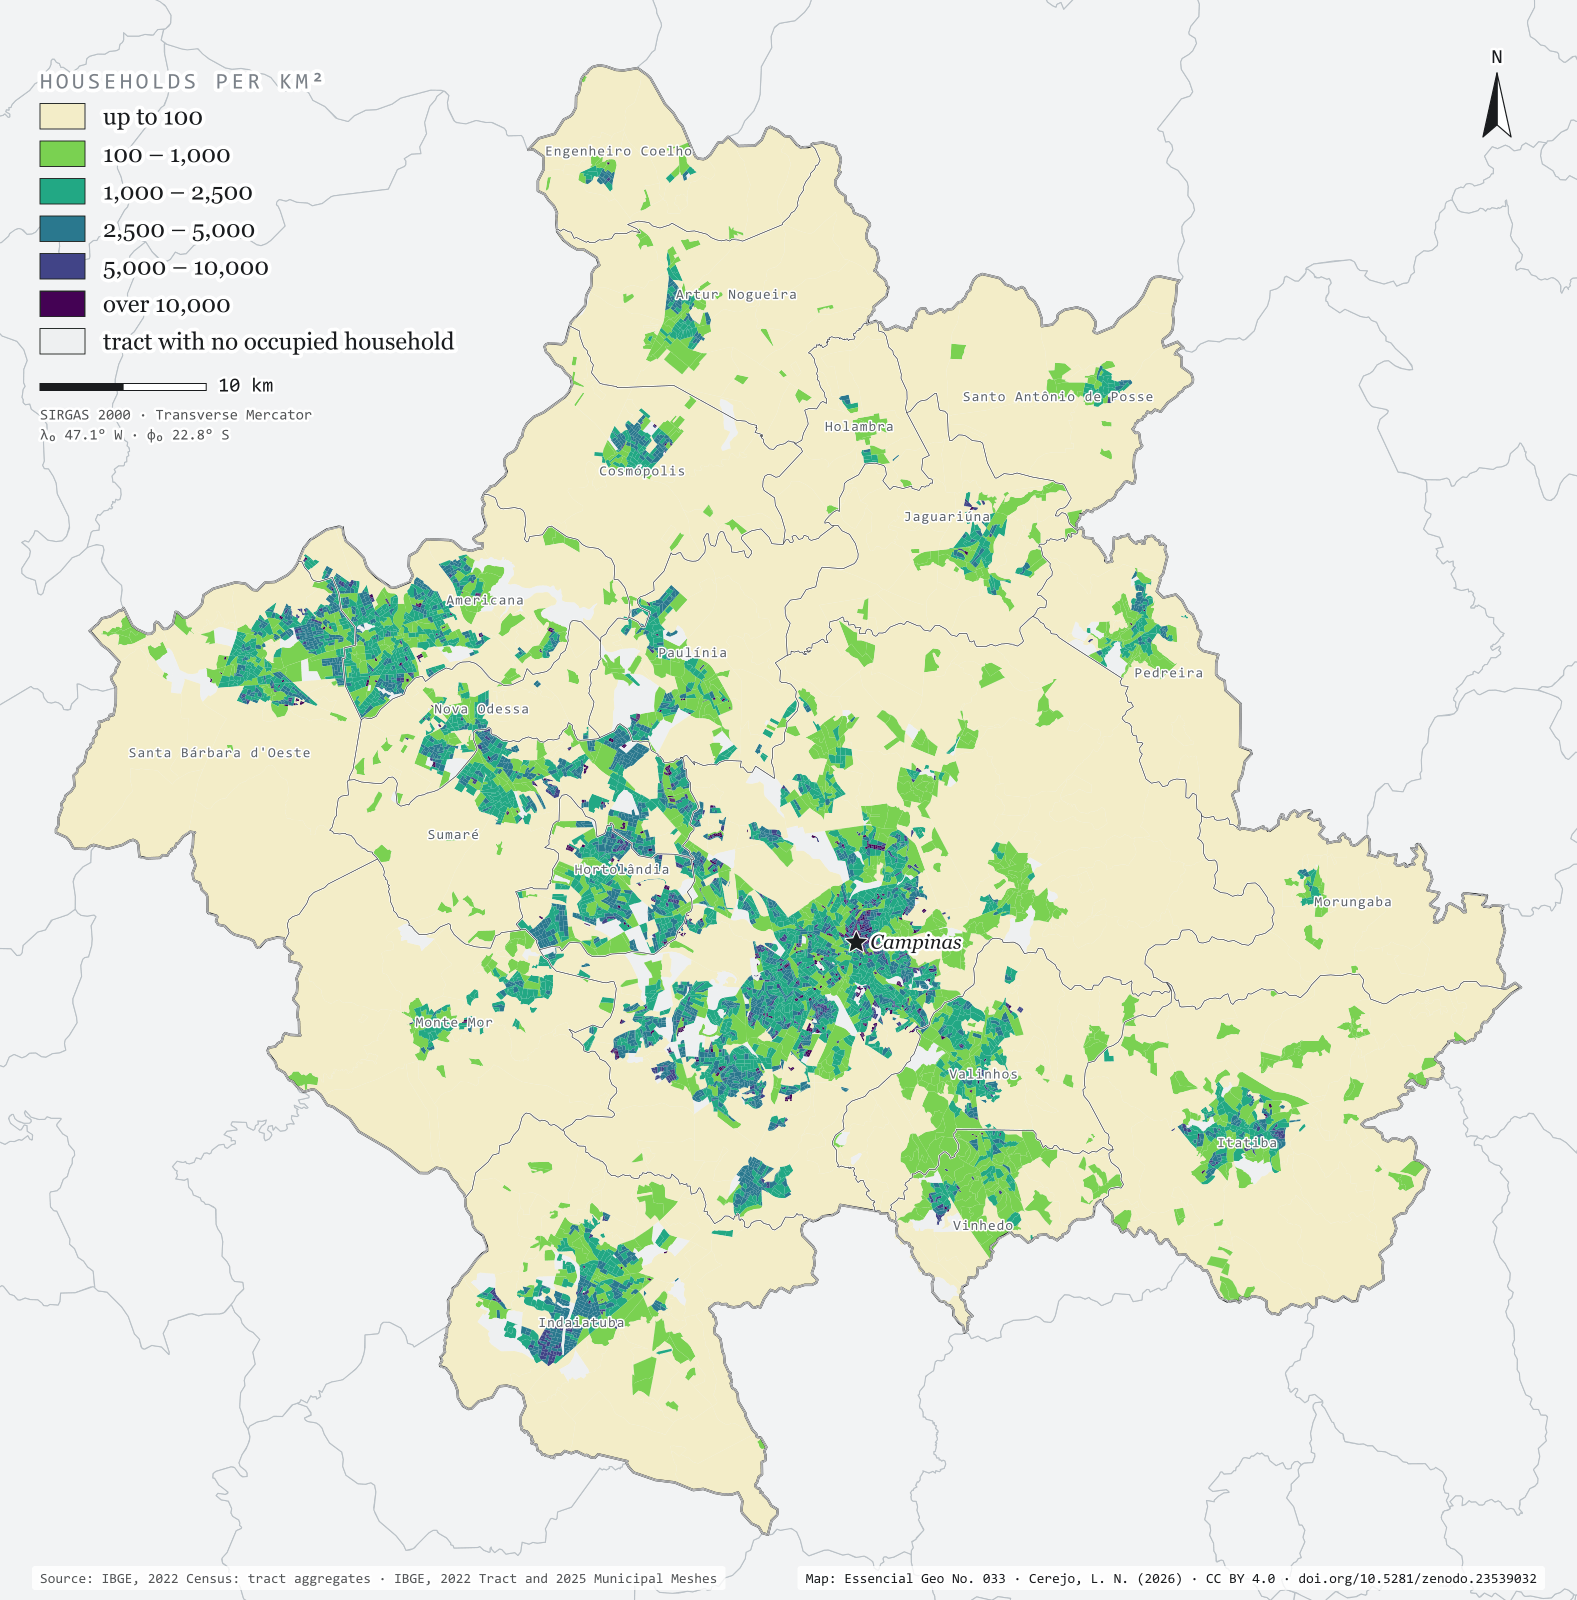
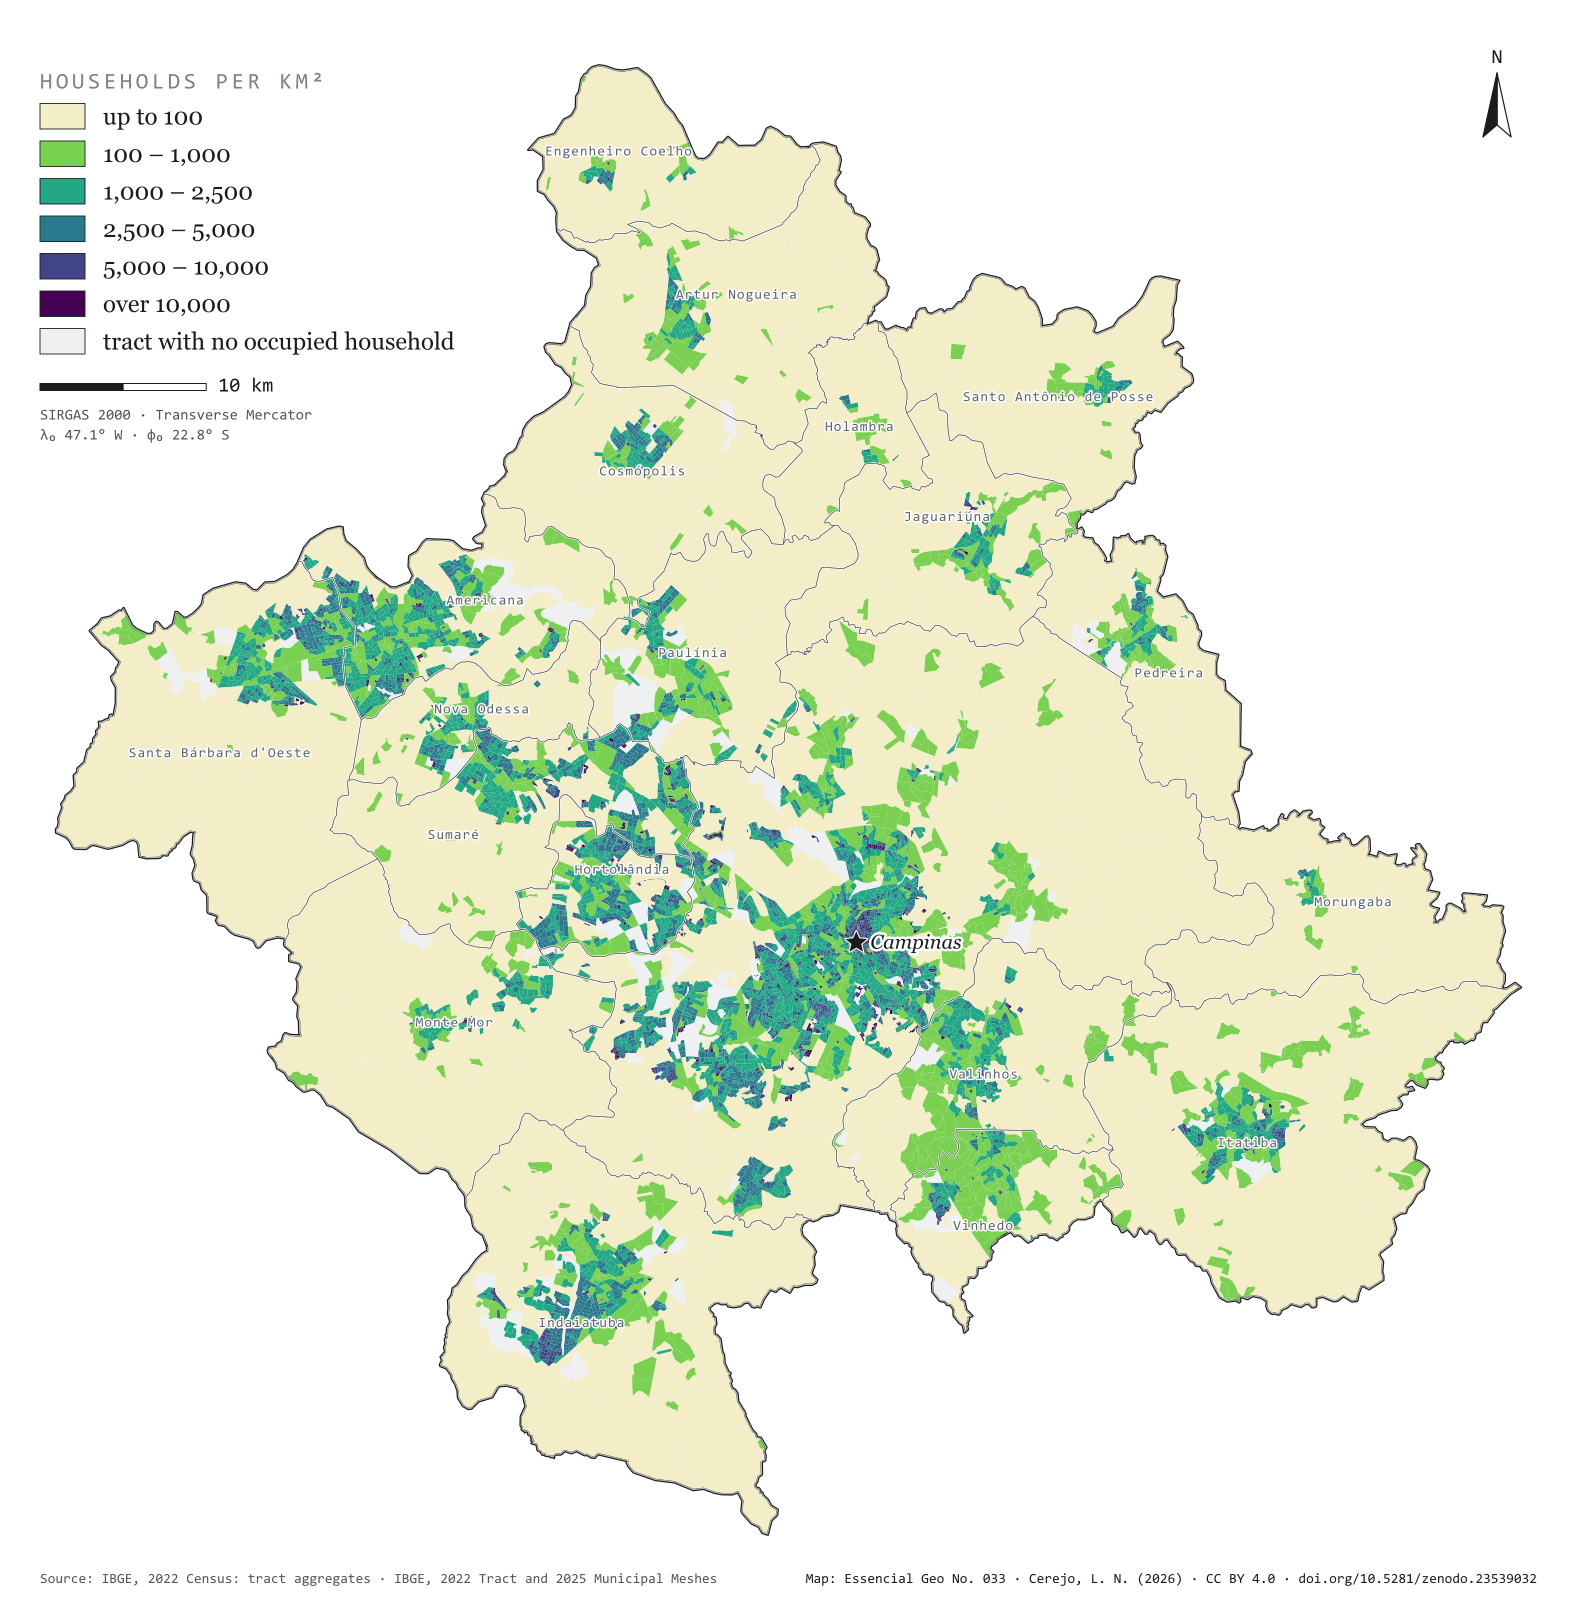
Fig. 033Campinas Metropolitan Region (SP)EPSG:4674Source: IBGE
The 2022 Census counted 1,157,476 occupied households in the 20 municipalities of the Campinas Metropolitan Region, home to 3,179,156 people. Half of those homes fit into 129 km², 3.4% of the region’s area. The map colours each of the 6,548 census tracts by households per km² and shows the city in layers: central Campinas and the neighbourhoods of Sumaré, Hortolândia and Americana above 5,000, the fringe of housing estates between 1,000 and 5,000 and, all around, the countryside, below 100. Hortolândia is the densest municipality, with 1,295 households per km²; Morungaba the least dense, with 33. Second plate of the collection “Campinas Metropolitan Region”.
Technical record · downloads · citation
At a glance
The region’s households, by tract density (households per km²) (households)
até 1002.1%
100 – 1.00013.2%
1.000 – 2.50032.6%
2.500 – 5.00033.2%
5.000 – 10.0009.1%
mais de 10.0009.9%
Households per km², whole municipality (five densest) (households/km²)
Hortolândia1,295
Americana666
Sumaré642
Campinas541
Vinhedo339
Area holding half the households
129km²
3.4% of the region’s 3,791 km²
Layers
setorespolygon6,548 census tracts: urban/rural status, area, people, occupied households and households per km²
municipiospolygon20 municipalities: households, people, area, tracts and households per km²
The map without a frame, with legend, scale, reference system and credit written on it: ready for papers, lectures and slides. In two versions: with the basemap (neighbours and sea) or only the mapped area, on white.
CEREJO, Lucas Nakamura. Domicílios por km²: metade dos lares em 3,4 % do chão. Versão 1.0.0. [S. l.]: Zenodo, 2026. Conjunto de dados. DOI: 10.5281/zenodo.23539032. Disponível em: https://doi.org/10.5281/zenodo.23539032. Acesso em: 10 nov. 2026.
Cerejo, L. N. (2026). Domicílios por km²: metade dos lares em 3,4 % do chão [Households per km²: Half the homes on 3.4 % of the ground] (Version 1.0.0) [Data set]. Zenodo. https://doi.org/10.5281/zenodo.23539032
@dataset{cerejo2026_domicilios_rmc,
  author    = {Cerejo, Lucas Nakamura},
  title     = {Domicílios por km²: Metade dos lares em 3,4 % do chão},
  year      = {2026},
  publisher = {Zenodo},
  version   = {1.0.0},
  doi       = {10.5281/zenodo.23539032},
  url       = {https://doi.org/10.5281/zenodo.23539032},
  language  = {portuguese},
  note      = {English title: Households per km²: Half the homes on 3.4 % of the ground. Licence CC BY 4.0}
}
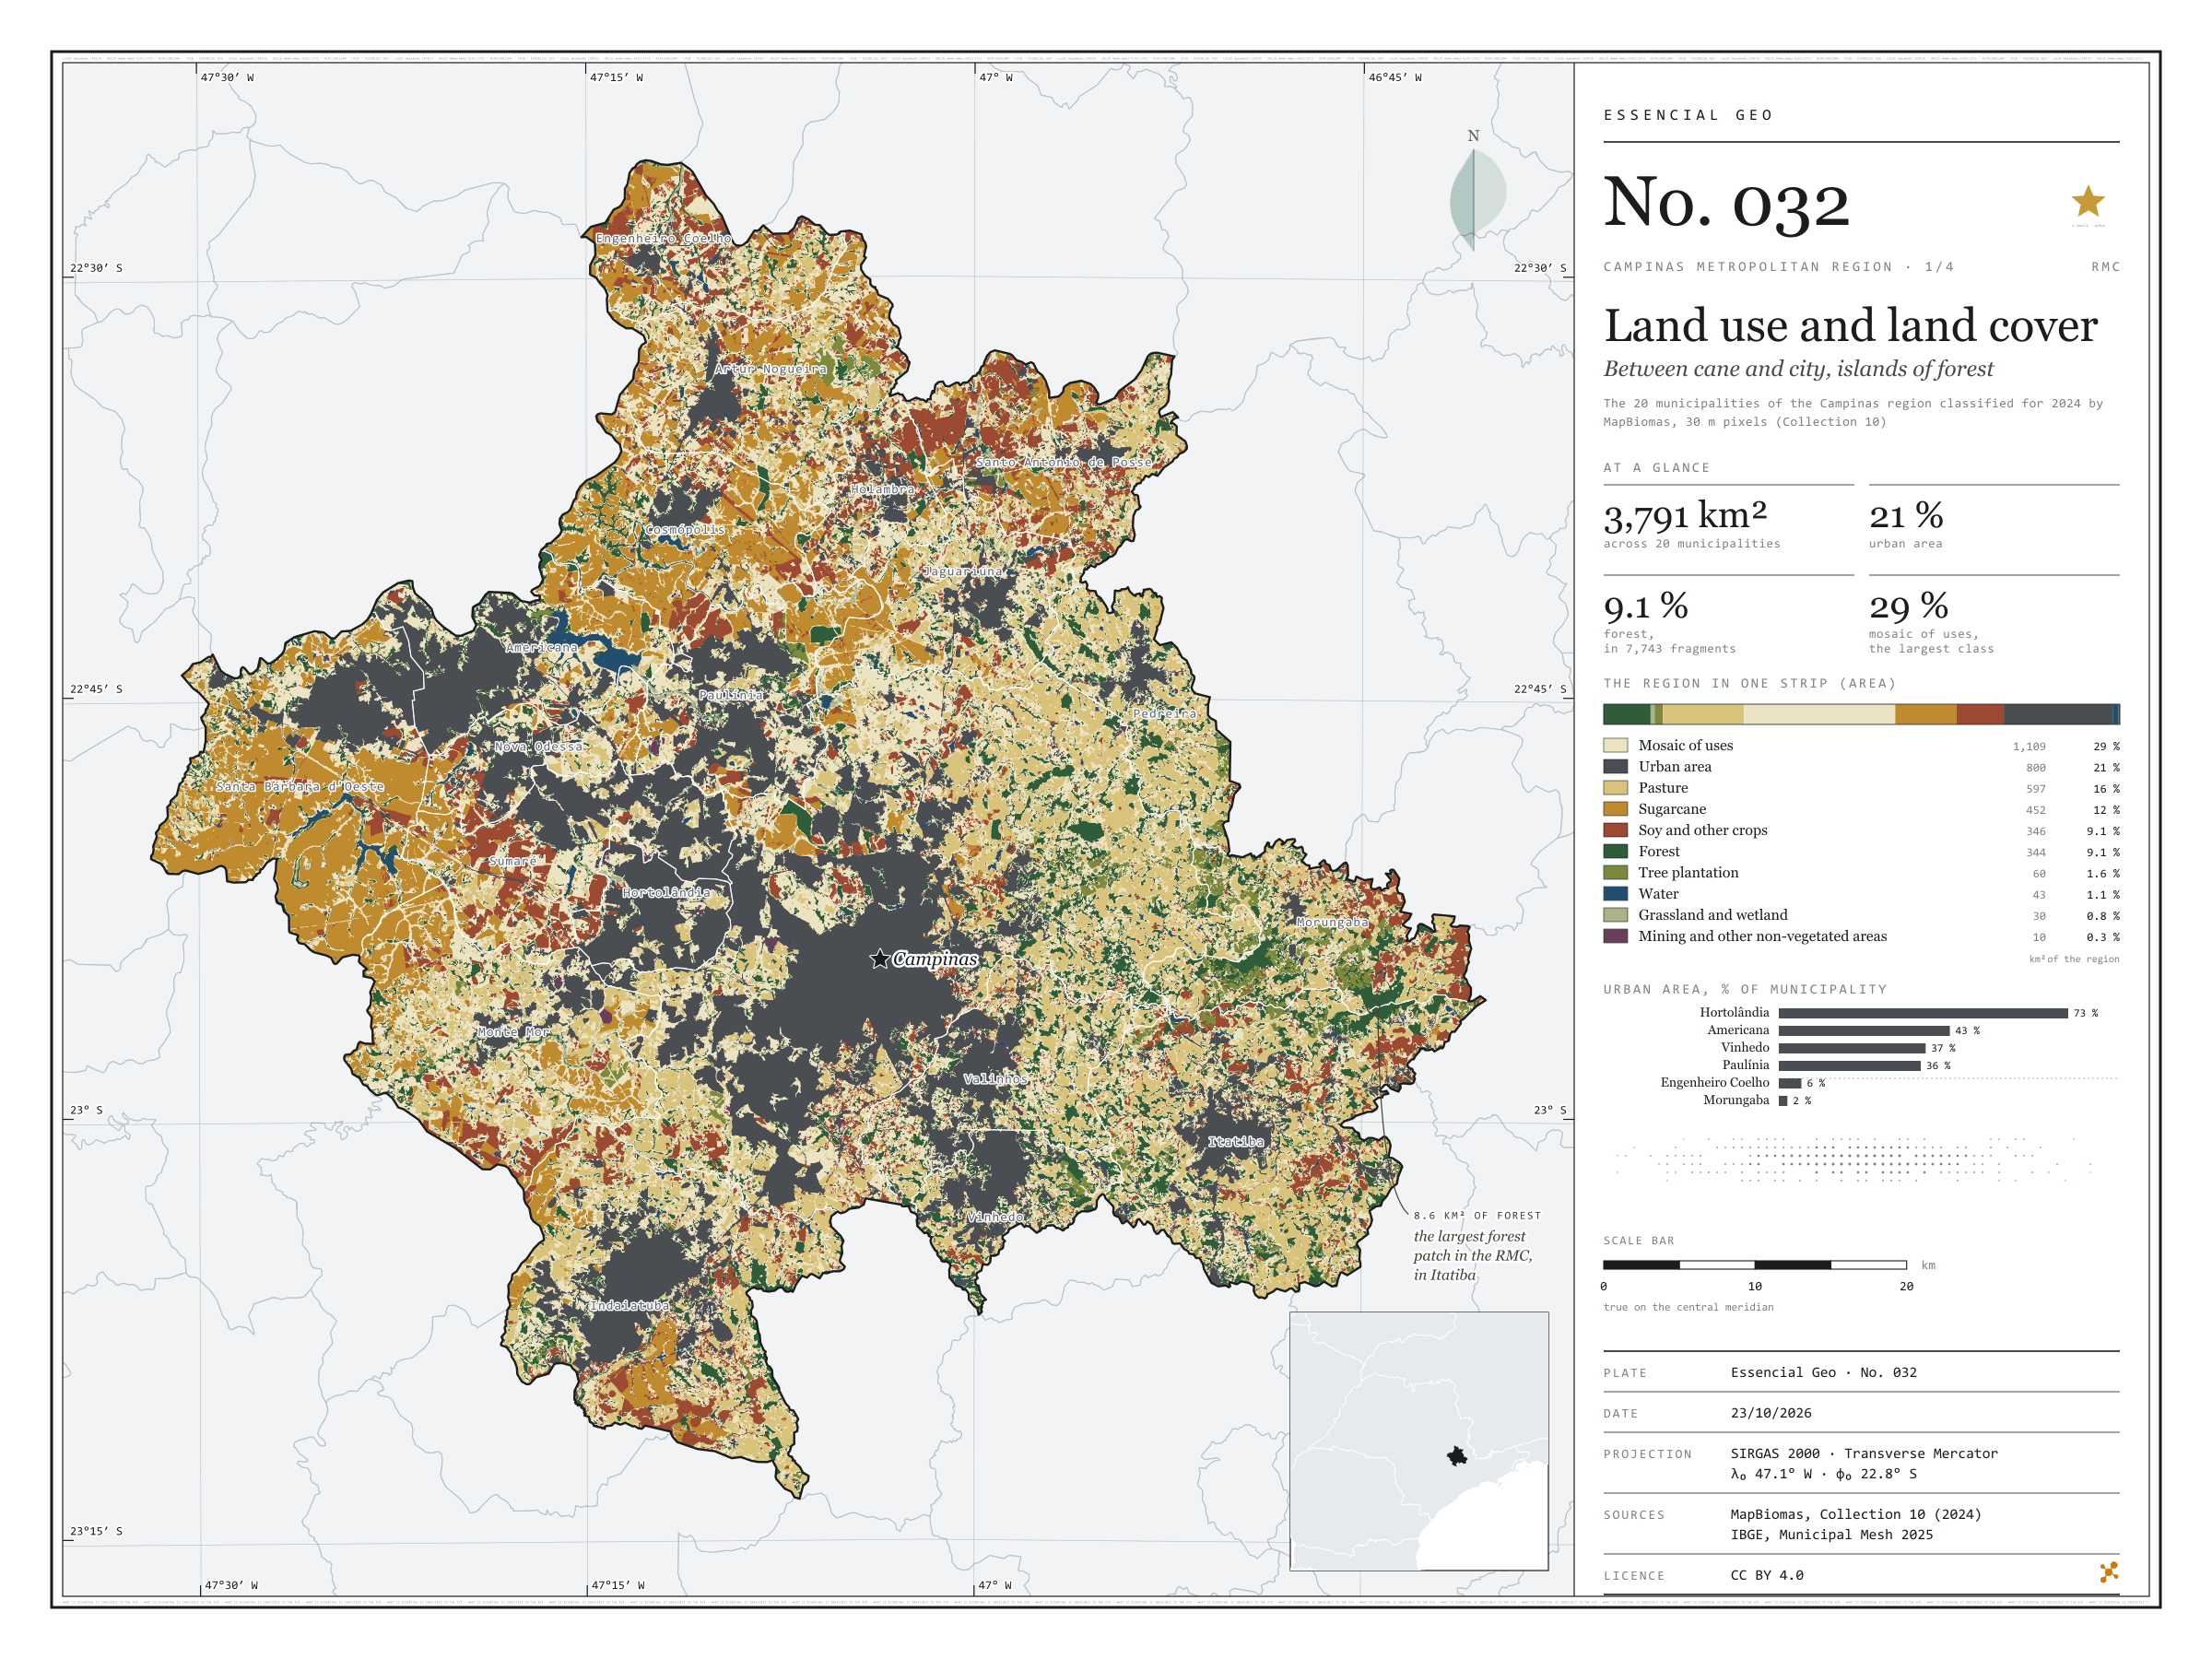
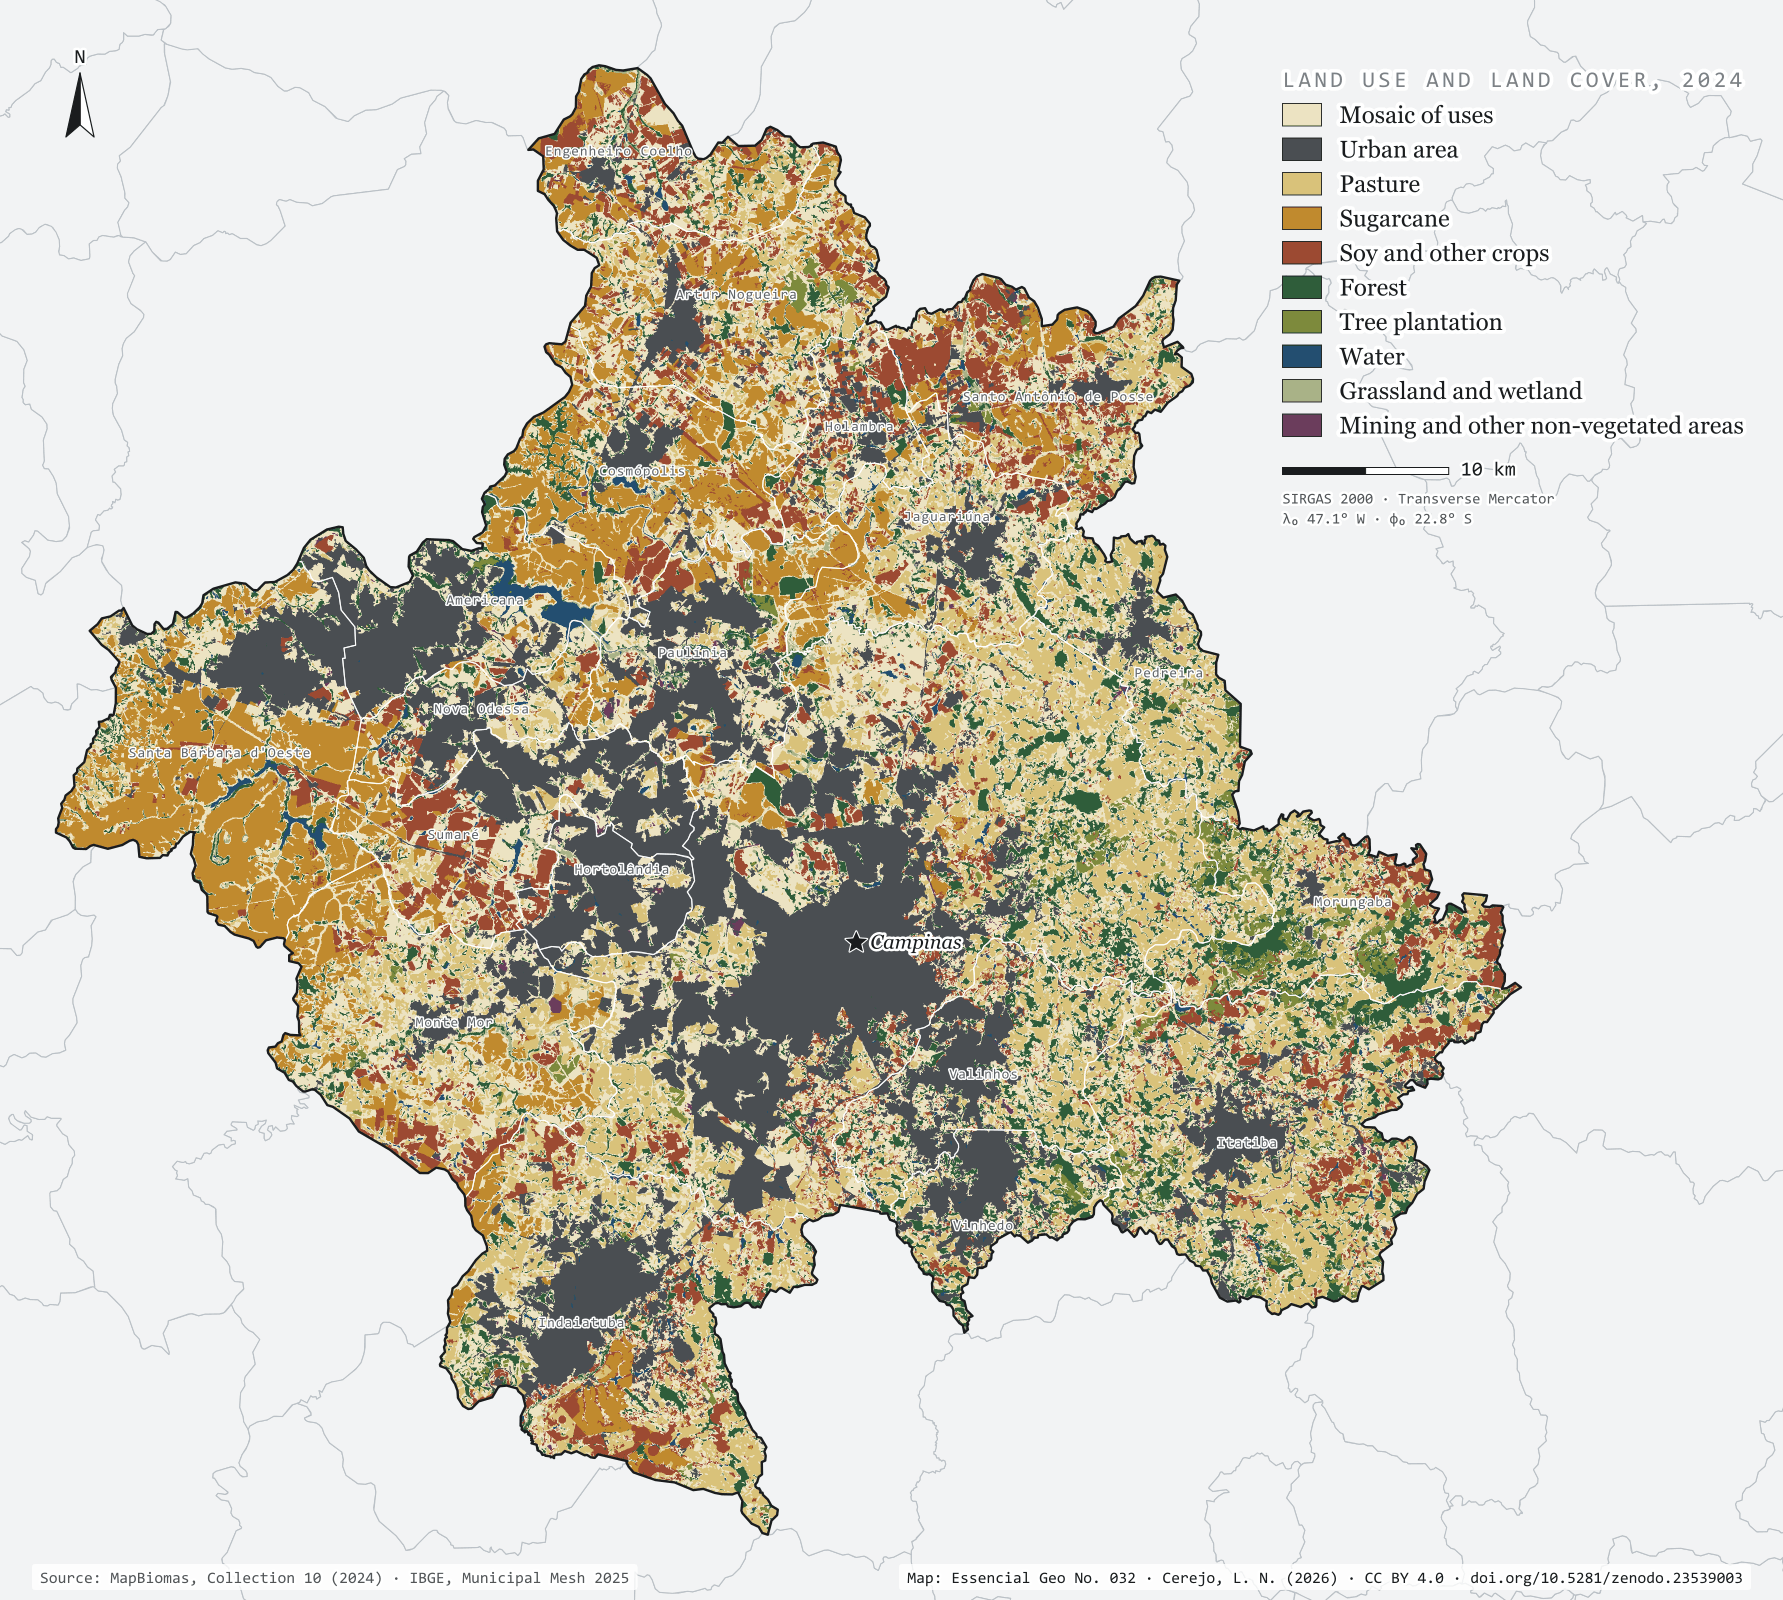
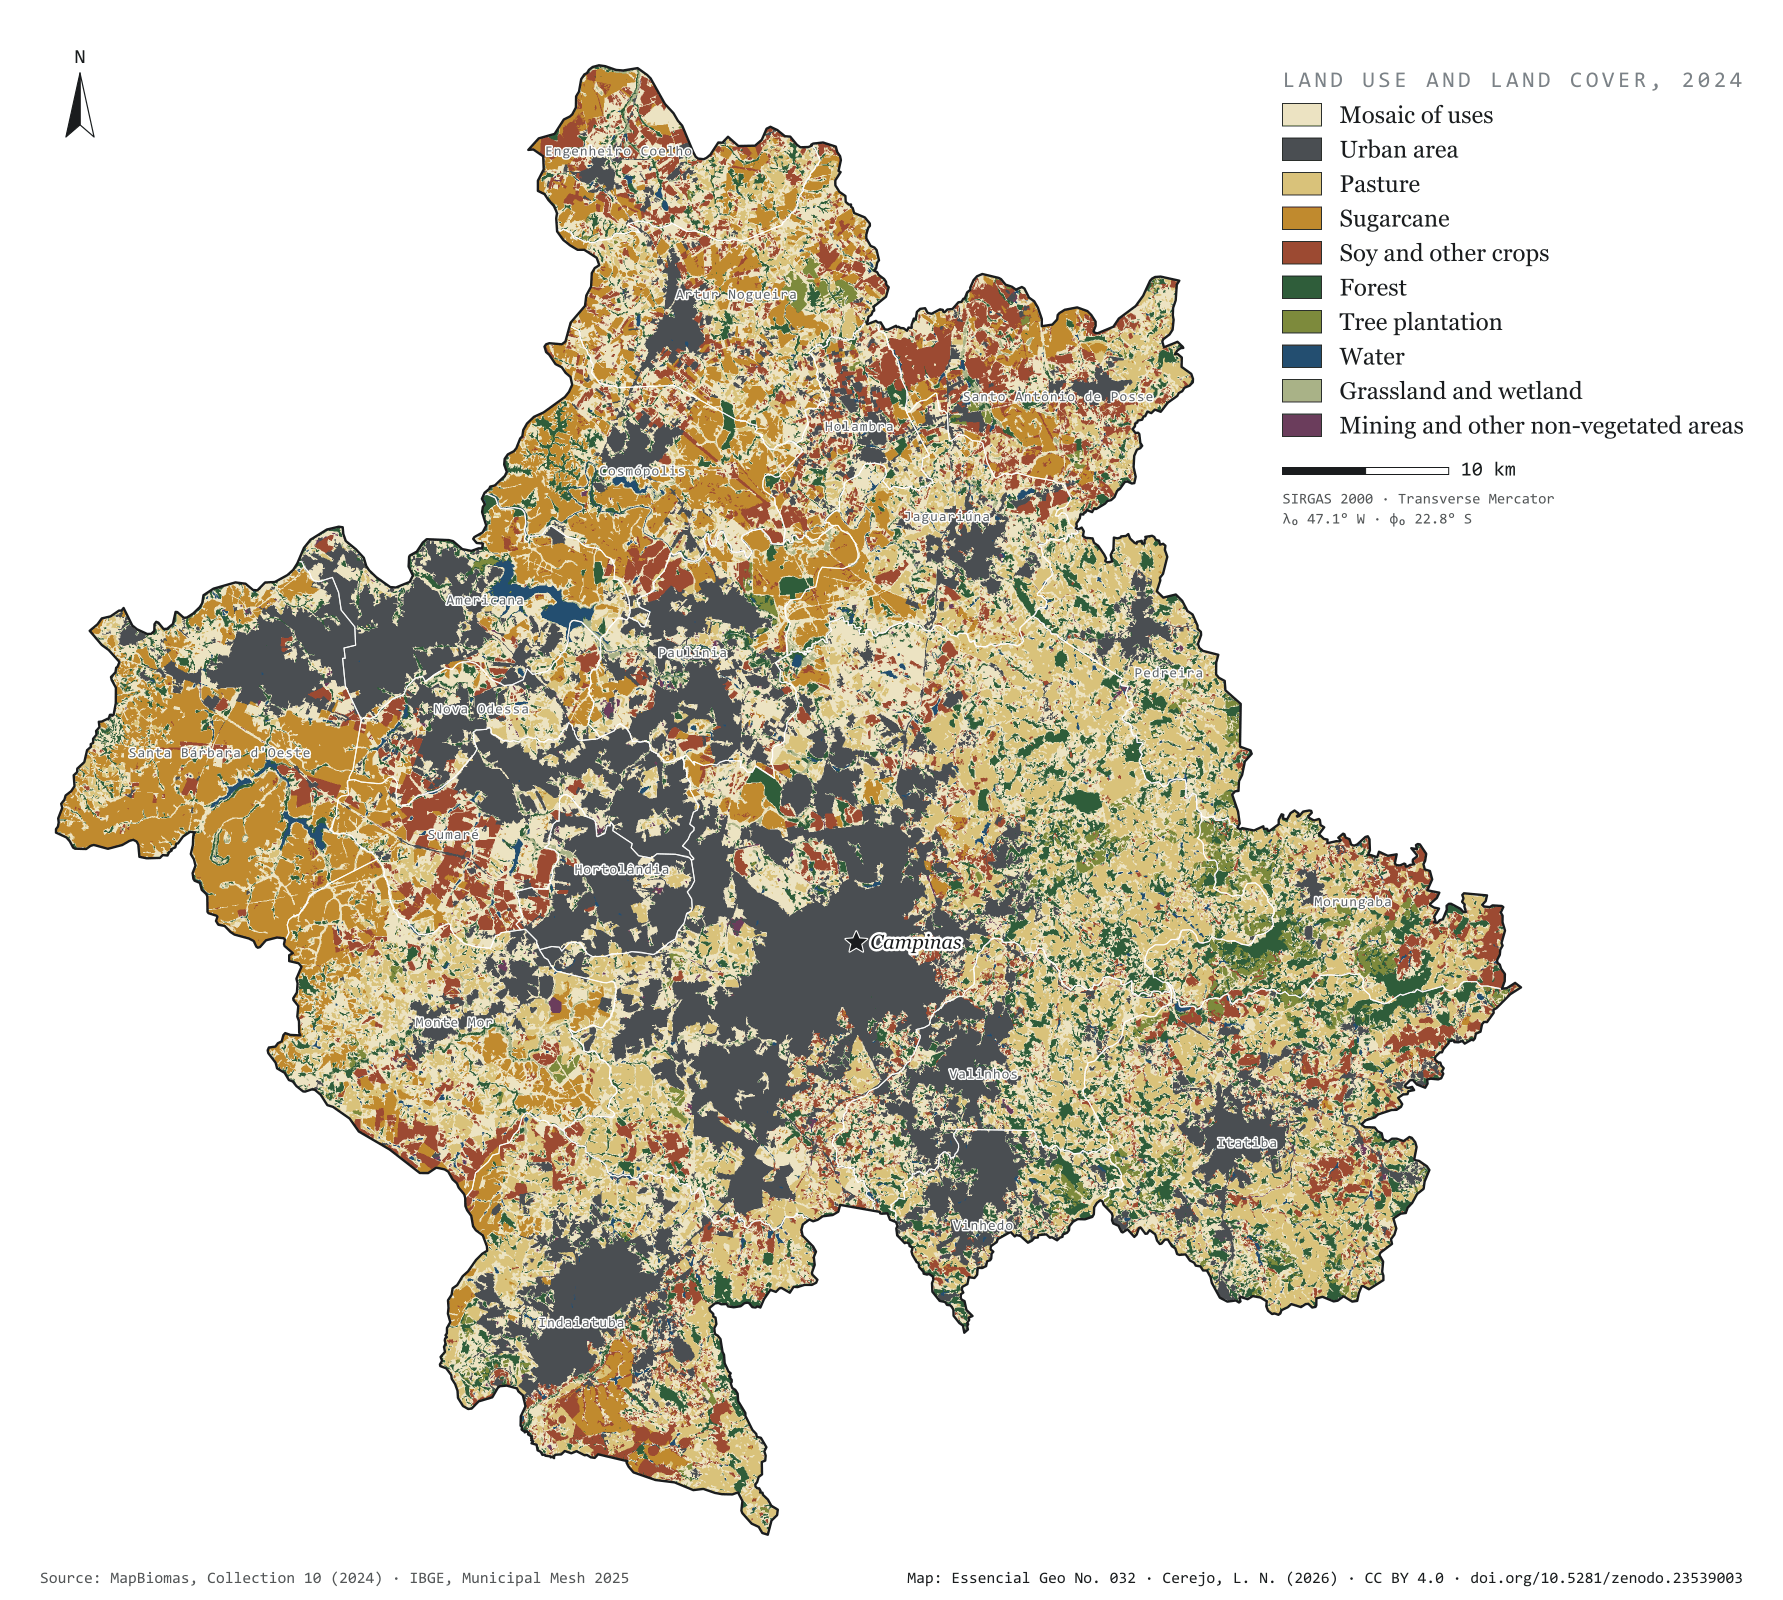
Fig. 032Campinas Metropolitan Region (SP)EPSG:4674Source: MapBiomas, IBGE
The grey patch of the city already covers 21.1% of the 3,791 km² of the Campinas Metropolitan Region, and 72.6% of Hortolândia. To the west, sugarcane takes half of Santa Bárbara d'Oeste (49.3%) and 39.7% of Cosmópolis. To the east, in the hills of Morungaba, Itatiba and Pedreira, the forest holds out in islands: 7,743 forest fragments, only 31 of them larger than 1 km². The largest, in Itatiba, covers 8.6 km². The most common class is none of these but the mosaic of uses (29.3%): pastures, small fields and country plots that the satellite cannot tell apart at 30 m. First plate of the collection “Campinas Metropolitan Region”.
Technical record · downloads · citation
At a glance
The region by land use and cover class (km²) (km²)
Mosaico de usos29.3%
Área urbanizada21.1%
Pastagem15.7%
Cana11.9%
Soja e outras lavouras9.1%
Formação florestal9.1%
Silvicultura1.6%
Água1.1%
Campo e área úmida0.8%
Mineração e outras áreas sem vegetação0.3%
Urban share of the municipality (top five) (%)
Hortolândia73
Americana43
Vinhedo37
Paulínia36
Sumaré35
Largest forest fragment
8.6km²
In Itatiba; there are 7,743 fragments, 31 of them over 1 km²
Layers
cobertura_2024rasterGeoTIFF of the 2024 classification clipped to the region, with the original MapBiomas codes and the plate’s palette in a .qml style
municipiospolygon20 municipalities: area and km² and % of each of the ten classes
MapBiomas Collection 10 classification for 2024, 30 m pixels, grouped into ten classes; each pixel’s area measured on the ellipsoid and summed for the region and for each municipality.
The map without a frame, with legend, scale, reference system and credit written on it: ready for papers, lectures and slides. In two versions: with the basemap (neighbours and sea) or only the mapped area, on white.
CEREJO, Lucas Nakamura. Uso e cobertura da terra: entre a cana e a cidade, ilhas de mata. Versão 1.0.0. [S. l.]: Zenodo, 2026. Conjunto de dados. DOI: 10.5281/zenodo.23539003. Disponível em: https://doi.org/10.5281/zenodo.23539003. Acesso em: 10 nov. 2026.
Cerejo, L. N. (2026). Uso e cobertura da terra: entre a cana e a cidade, ilhas de mata [Land use and land cover: Between cane and city, islands of forest] (Version 1.0.0) [Data set]. Zenodo. https://doi.org/10.5281/zenodo.23539003
@dataset{cerejo2026_uso_da_terra_rmc,
  author    = {Cerejo, Lucas Nakamura},
  title     = {Uso e cobertura da terra: Entre a cana e a cidade, ilhas de mata},
  year      = {2026},
  publisher = {Zenodo},
  version   = {1.0.0},
  doi       = {10.5281/zenodo.23539003},
  url       = {https://doi.org/10.5281/zenodo.23539003},
  language  = {portuguese},
  note      = {English title: Land use and land cover: Between cane and city, islands of forest. Licence CC BY 4.0}
}
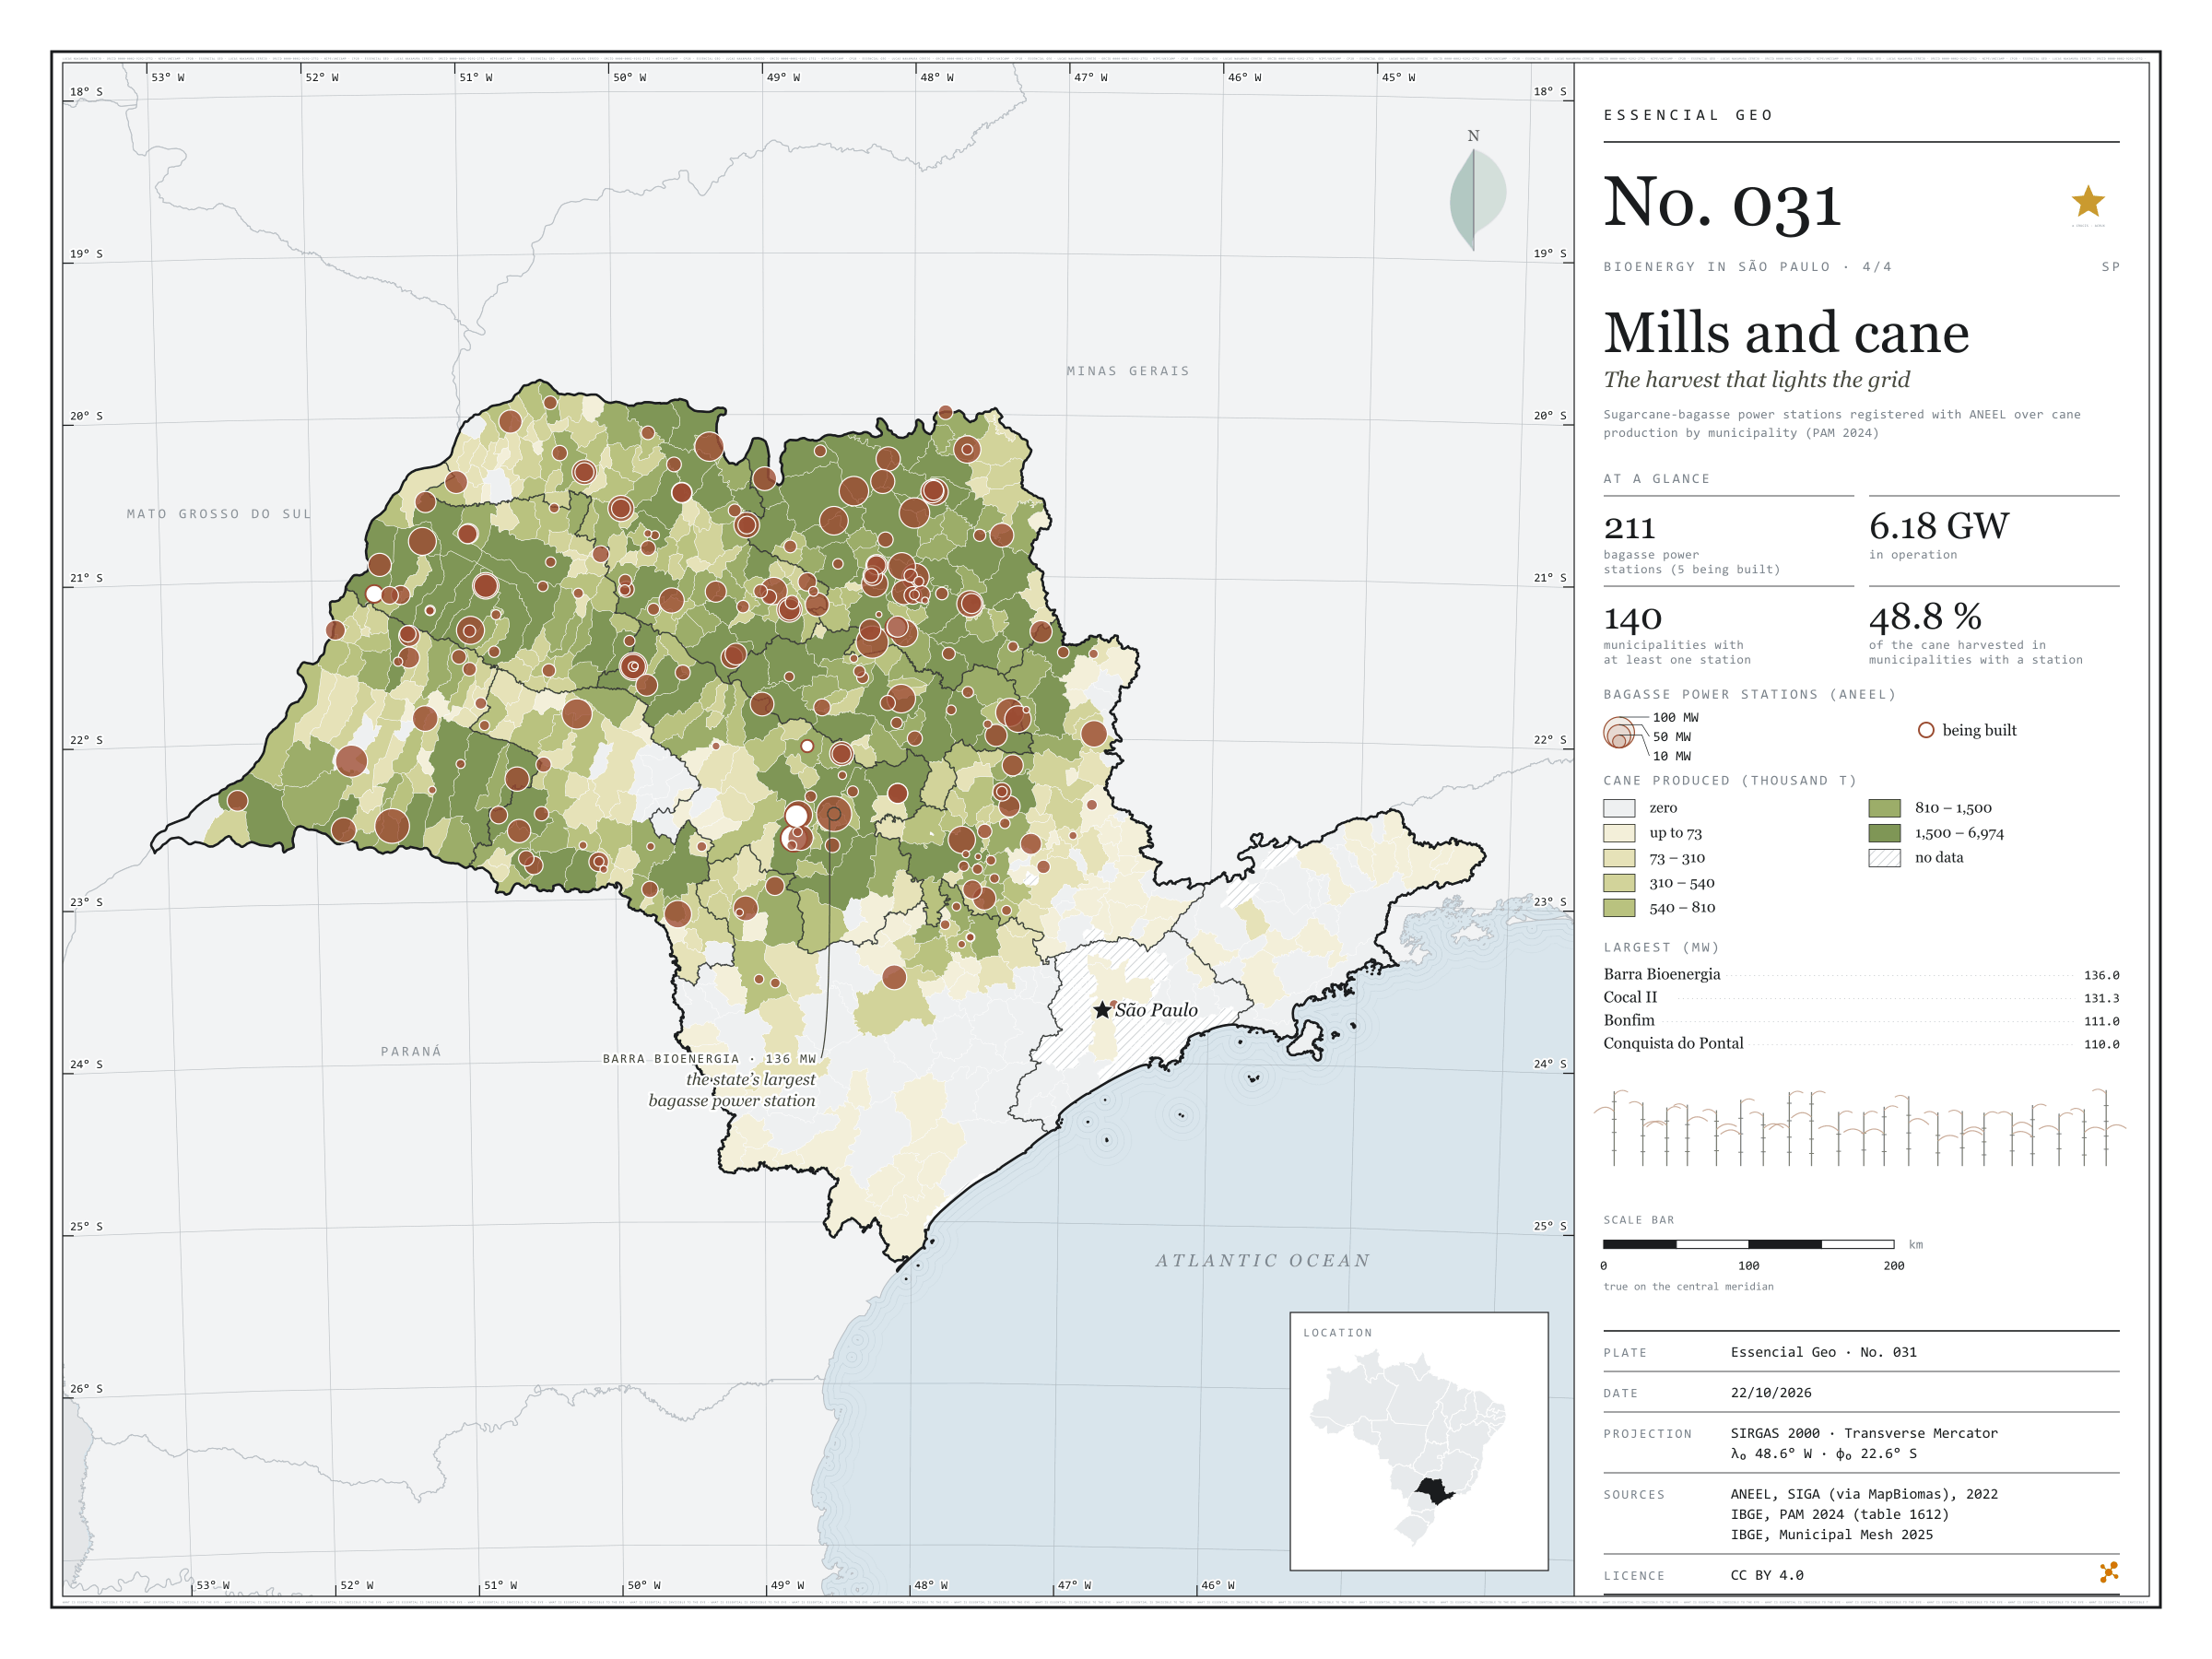
Fig. 031São Paulo state (SP)EPSG:4674Source: ANEEL, IBGE, EPE
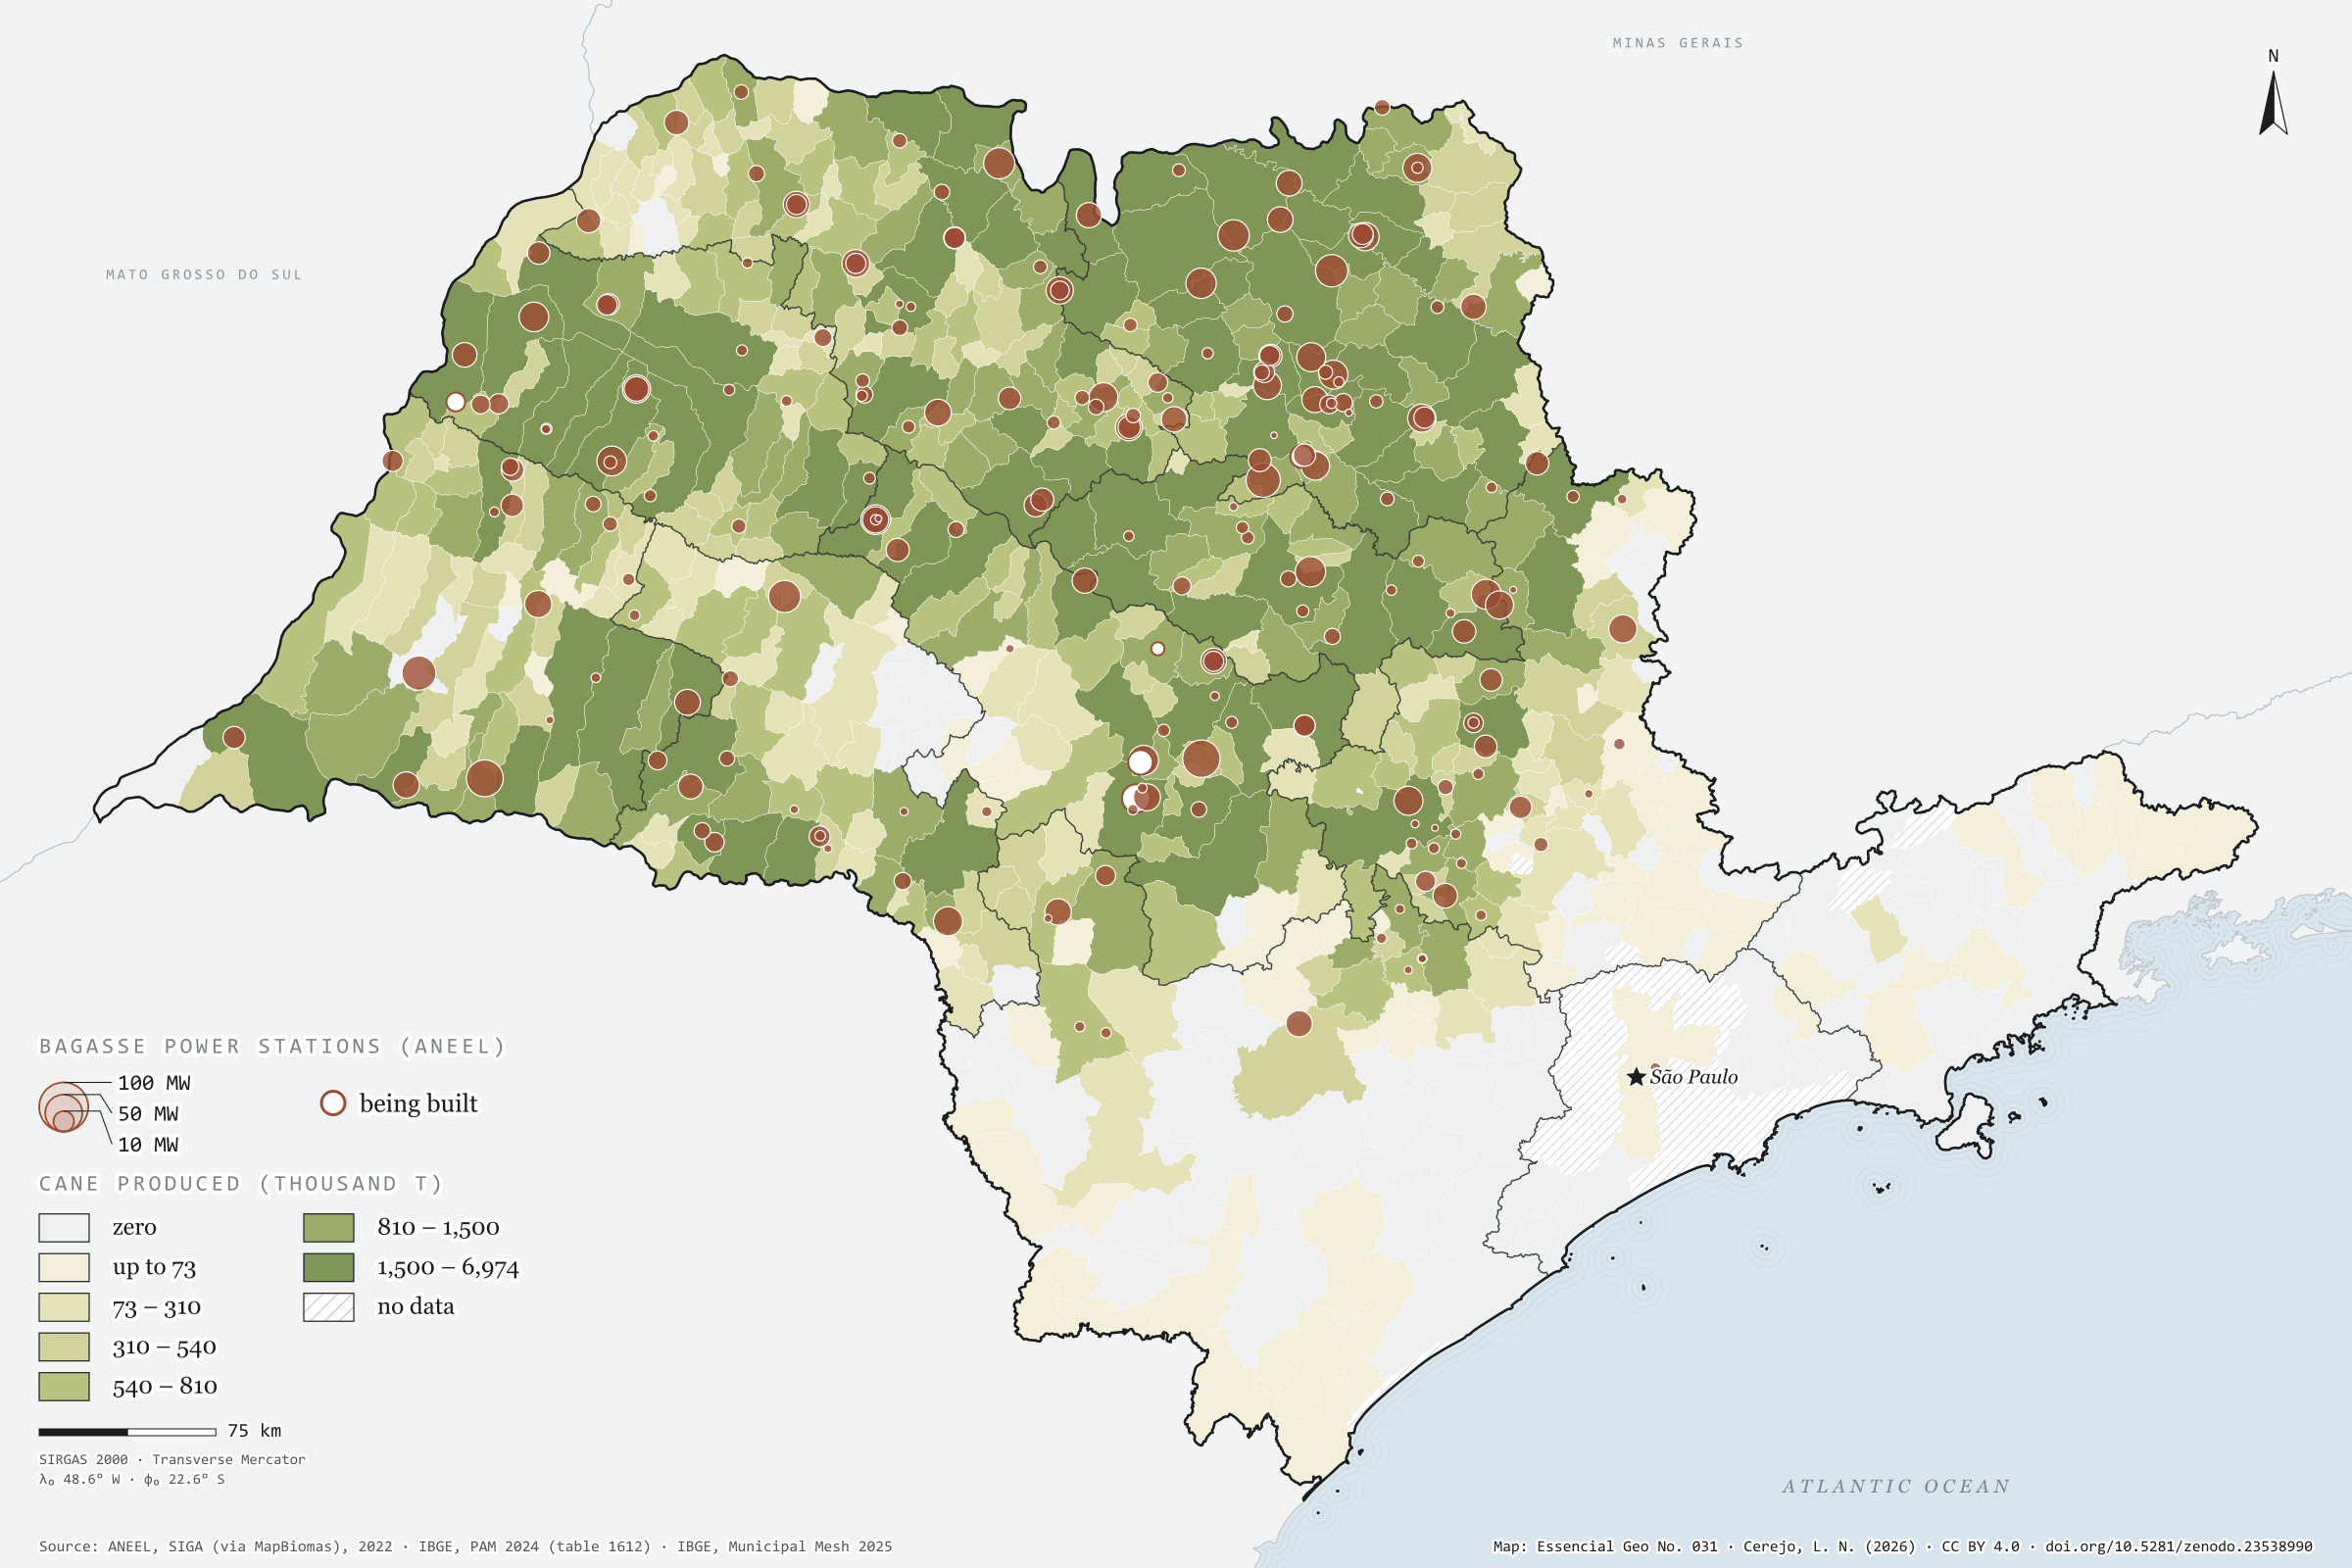
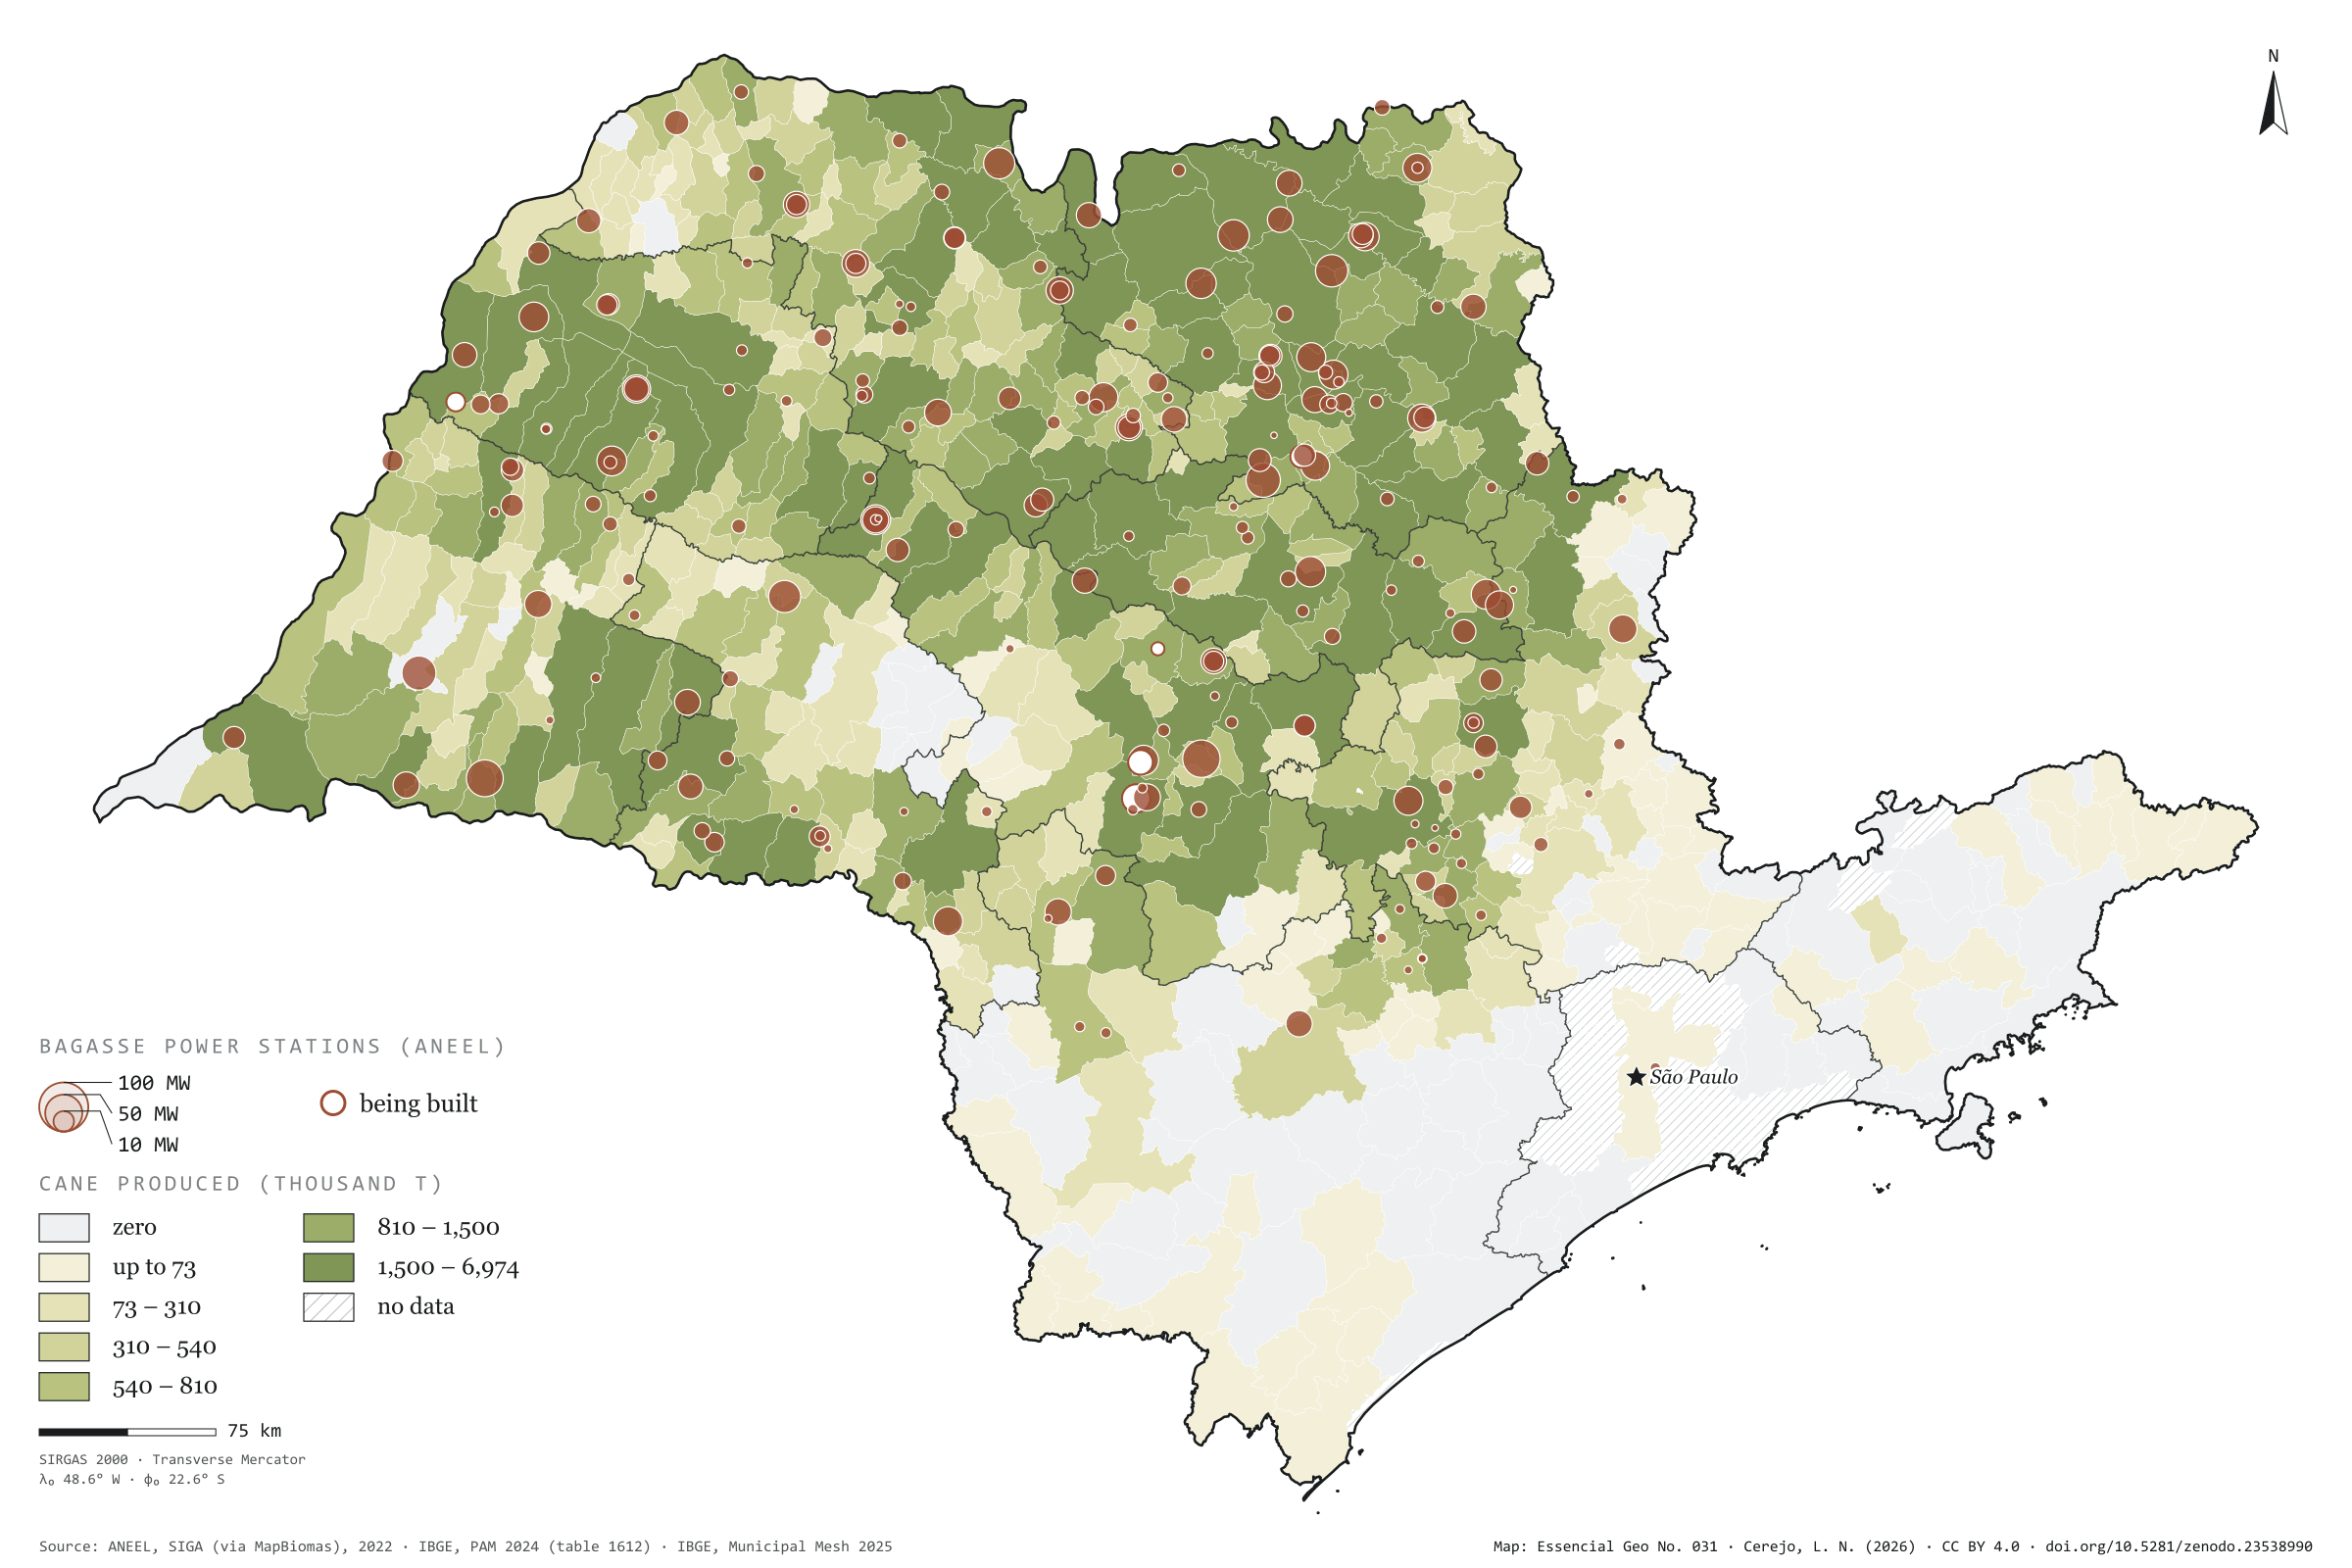
After crushing, sugarcane bagasse goes into the boiler, and the steam makes the mill’s own electricity plus a surplus for the grid. In São Paulo, 211 bagasse power stations are registered with ANEEL, 206 of them in operation, with 6.18 GW of licensed capacity; the largest, Barra Bioenergia in Barra Bonita, has 136 MW. Over the map of cane harvested in 2024, the circles show that the energy is born where the crop is: the 140 municipalities with at least one such station accounted for 48.8% of the cane harvested in the state. There, between cane field and substation, waste becomes grid. Final plate of the collection “Bioenergy in São Paulo”.
Technical record · downloads · citation
At a glance
Bagasse capacity in operation
6,179MW
206 stations in operation and 5 being built
Largest bagasse power stations (MW)
Barra Bioenergia136
Cocal II131
Bonfim111
Conquista do Pontal110
Vale do Rosário97
Cane in municipalities with a station
49%
140 municipalities with at least one bagasse power station
Layers
ute_bagacopoint211 sugarcane-bagasse power stations: phase, capacity (kW), start of operations
usinas_epe_2018point161 sugar-energy mills from the EPE WebMap 2018: type, crushing class, ethanol capacity
municipiospolygon645 municipalities: cane production (t), number and capacity of power stations
regioes_intermediariaspolygon11 intermediate geographic regions
The map without a frame, with legend, scale, reference system and credit written on it: ready for papers, lectures and slides. In two versions: with the basemap (neighbours and sea) or only the mapped area, on white.
CEREJO, Lucas Nakamura. Usinas e cana: a colheita que acende a rede. Versão 1.0.0. [S. l.]: Zenodo, 2026. Conjunto de dados. DOI: 10.5281/zenodo.23538990. Disponível em: https://doi.org/10.5281/zenodo.23538990. Acesso em: 10 nov. 2026.
Cerejo, L. N. (2026). Usinas e cana: a colheita que acende a rede [Mills and cane: The harvest that lights the grid] (Version 1.0.0) [Data set]. Zenodo. https://doi.org/10.5281/zenodo.23538990
@dataset{cerejo2026_usinas_e_cana_sp,
  author    = {Cerejo, Lucas Nakamura},
  title     = {Usinas e cana: A colheita que acende a rede},
  year      = {2026},
  publisher = {Zenodo},
  version   = {1.0.0},
  doi       = {10.5281/zenodo.23538990},
  url       = {https://doi.org/10.5281/zenodo.23538990},
  language  = {portuguese},
  note      = {English title: Mills and cane: The harvest that lights the grid. Licence CC BY 4.0}
}
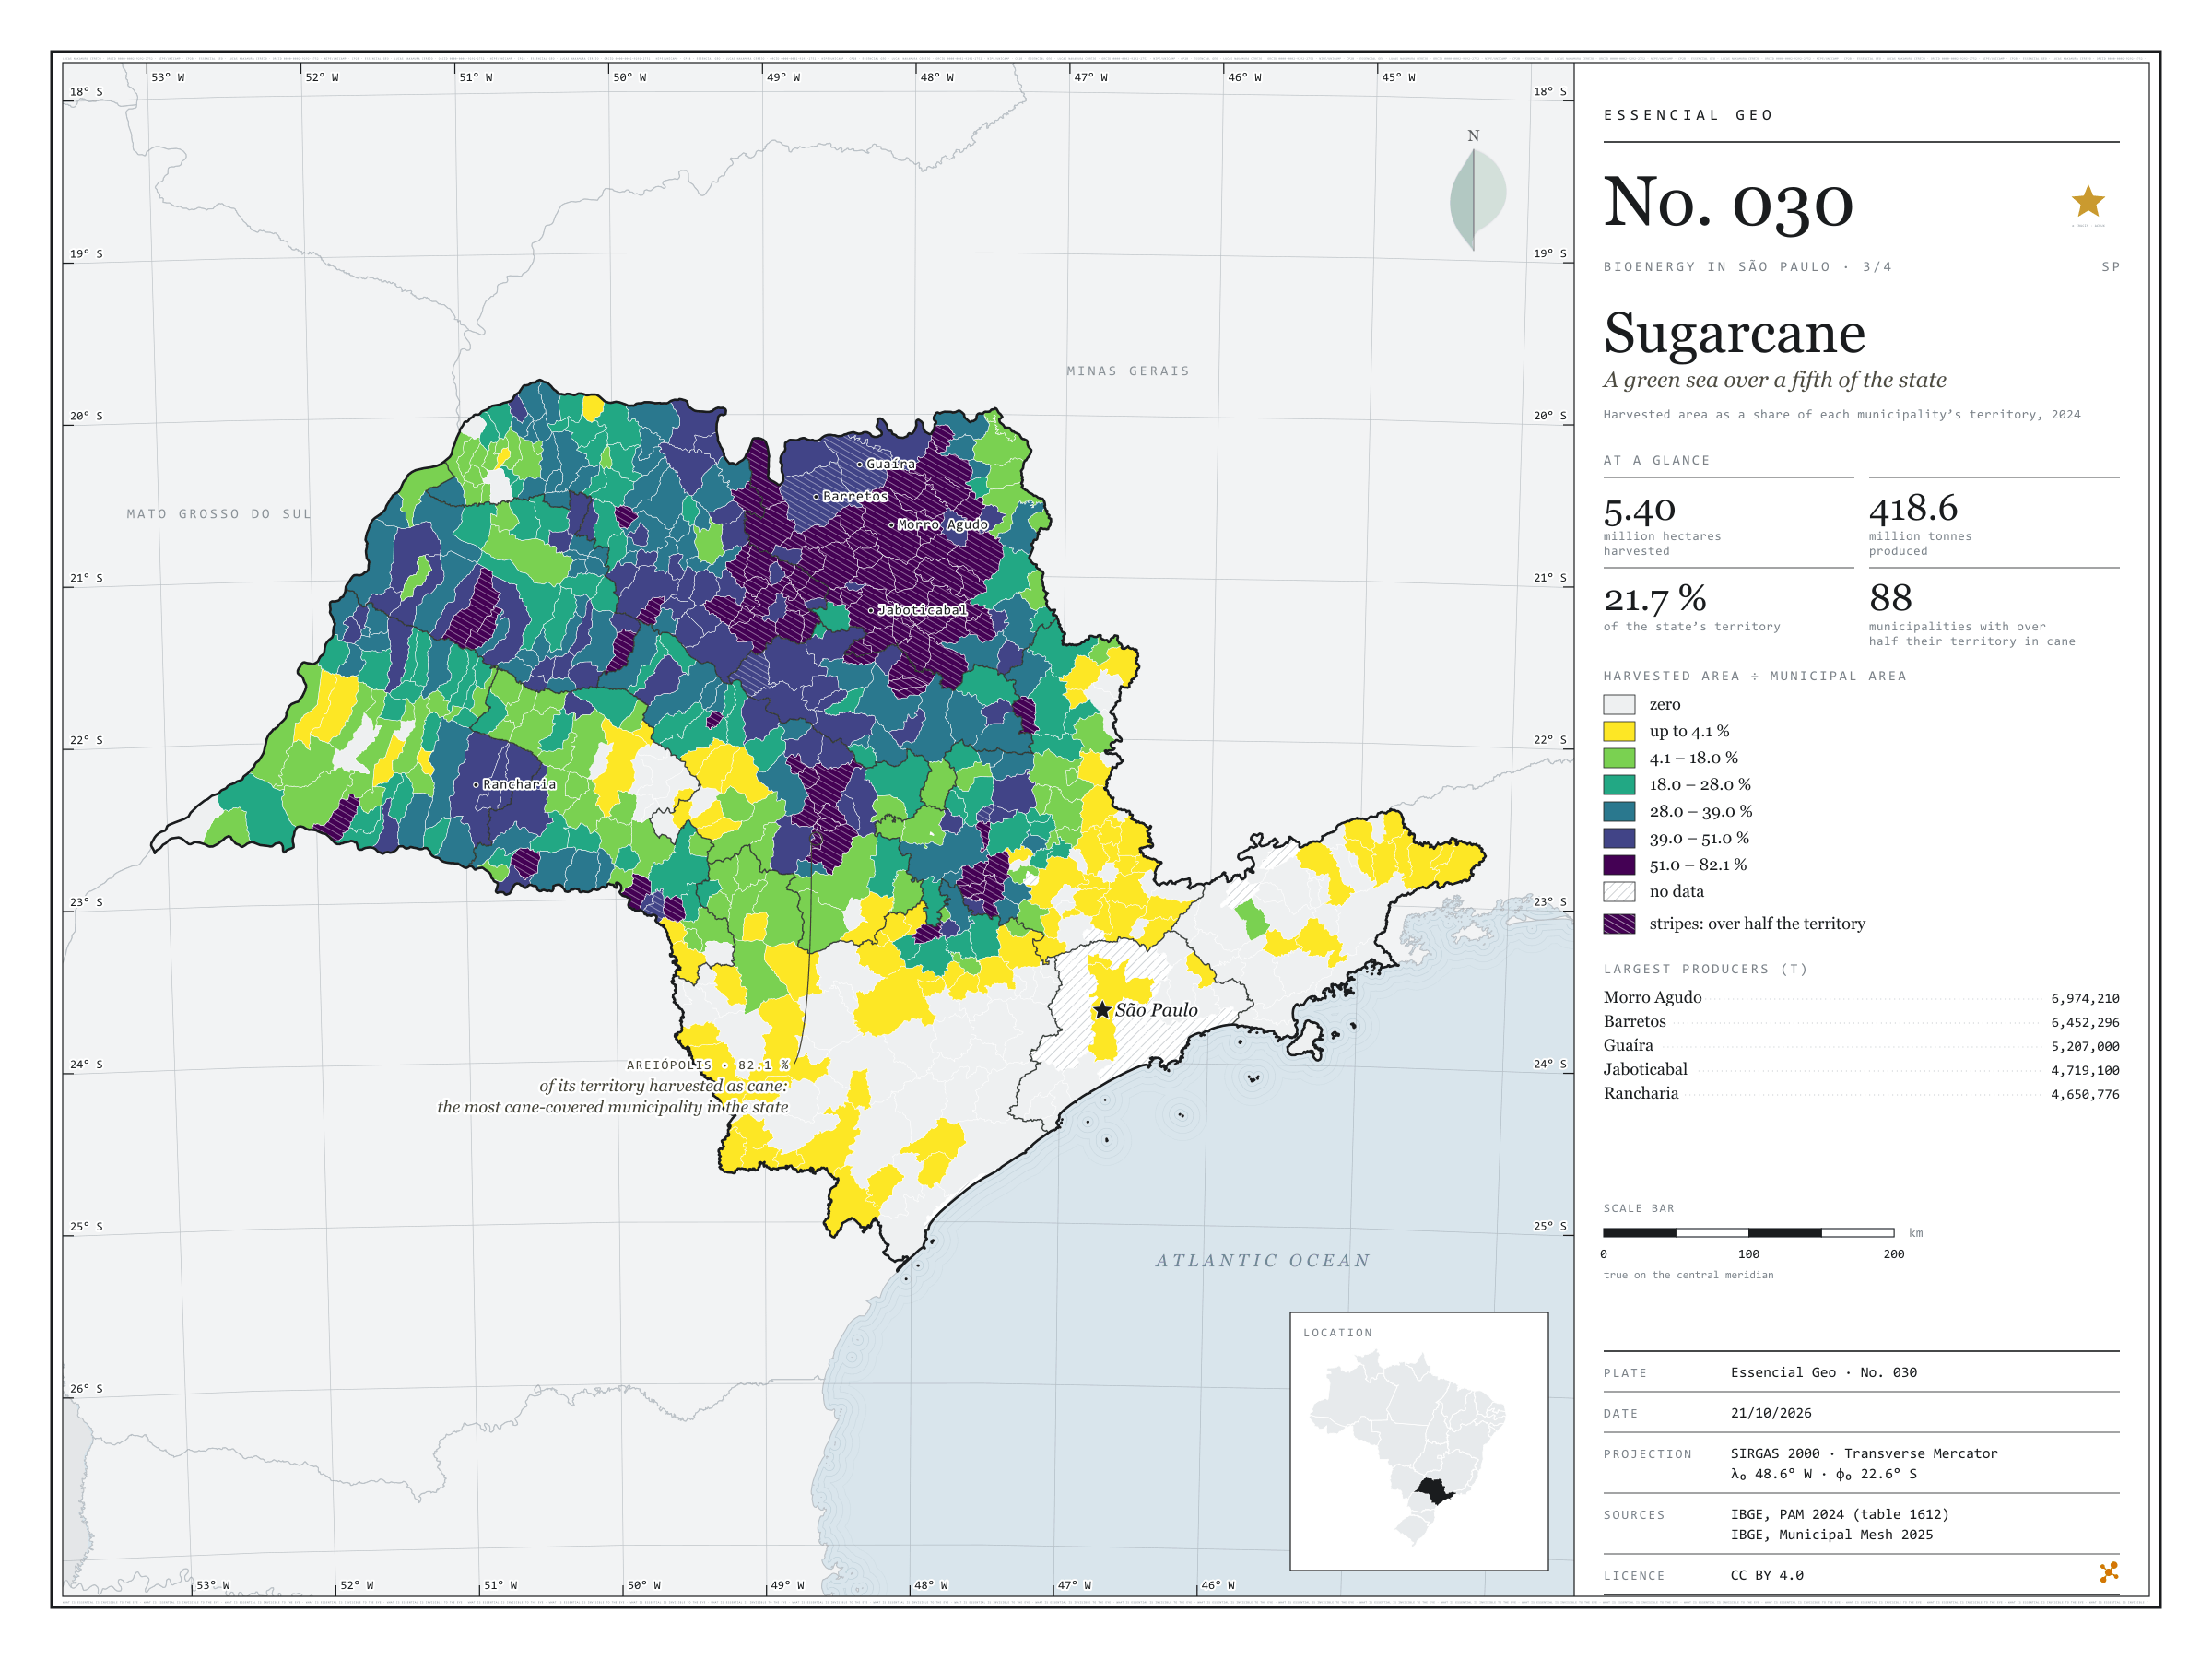
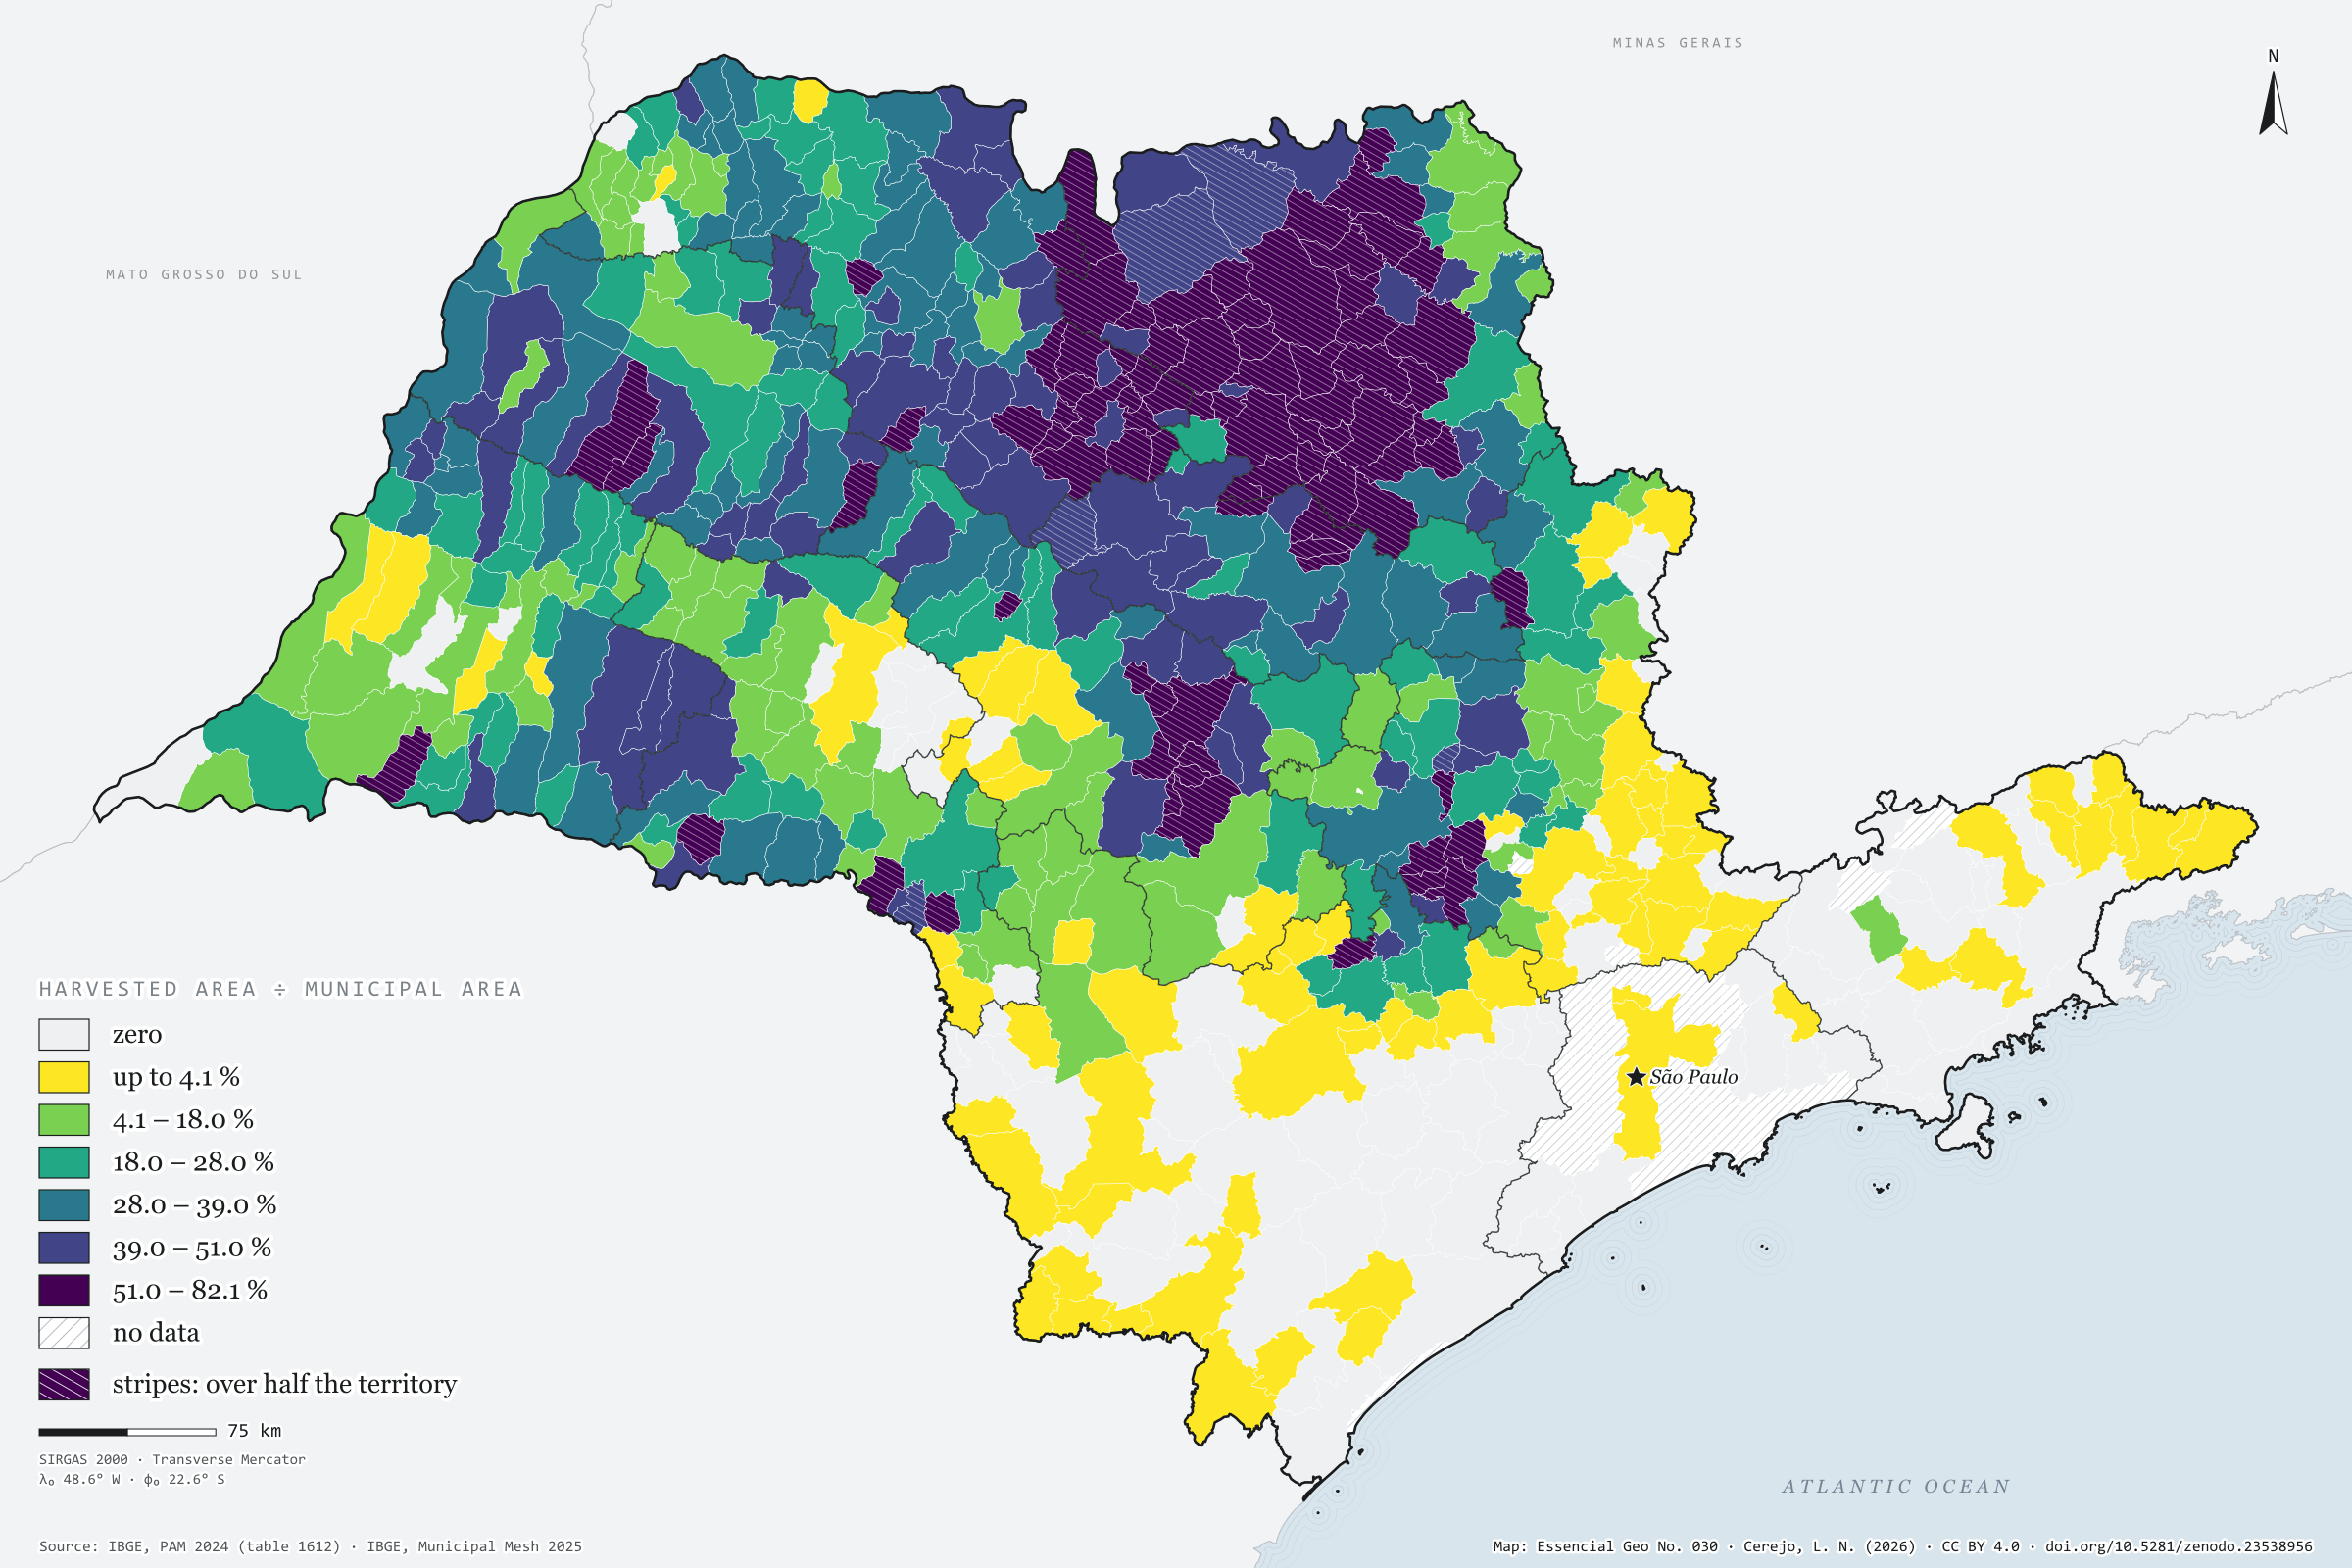
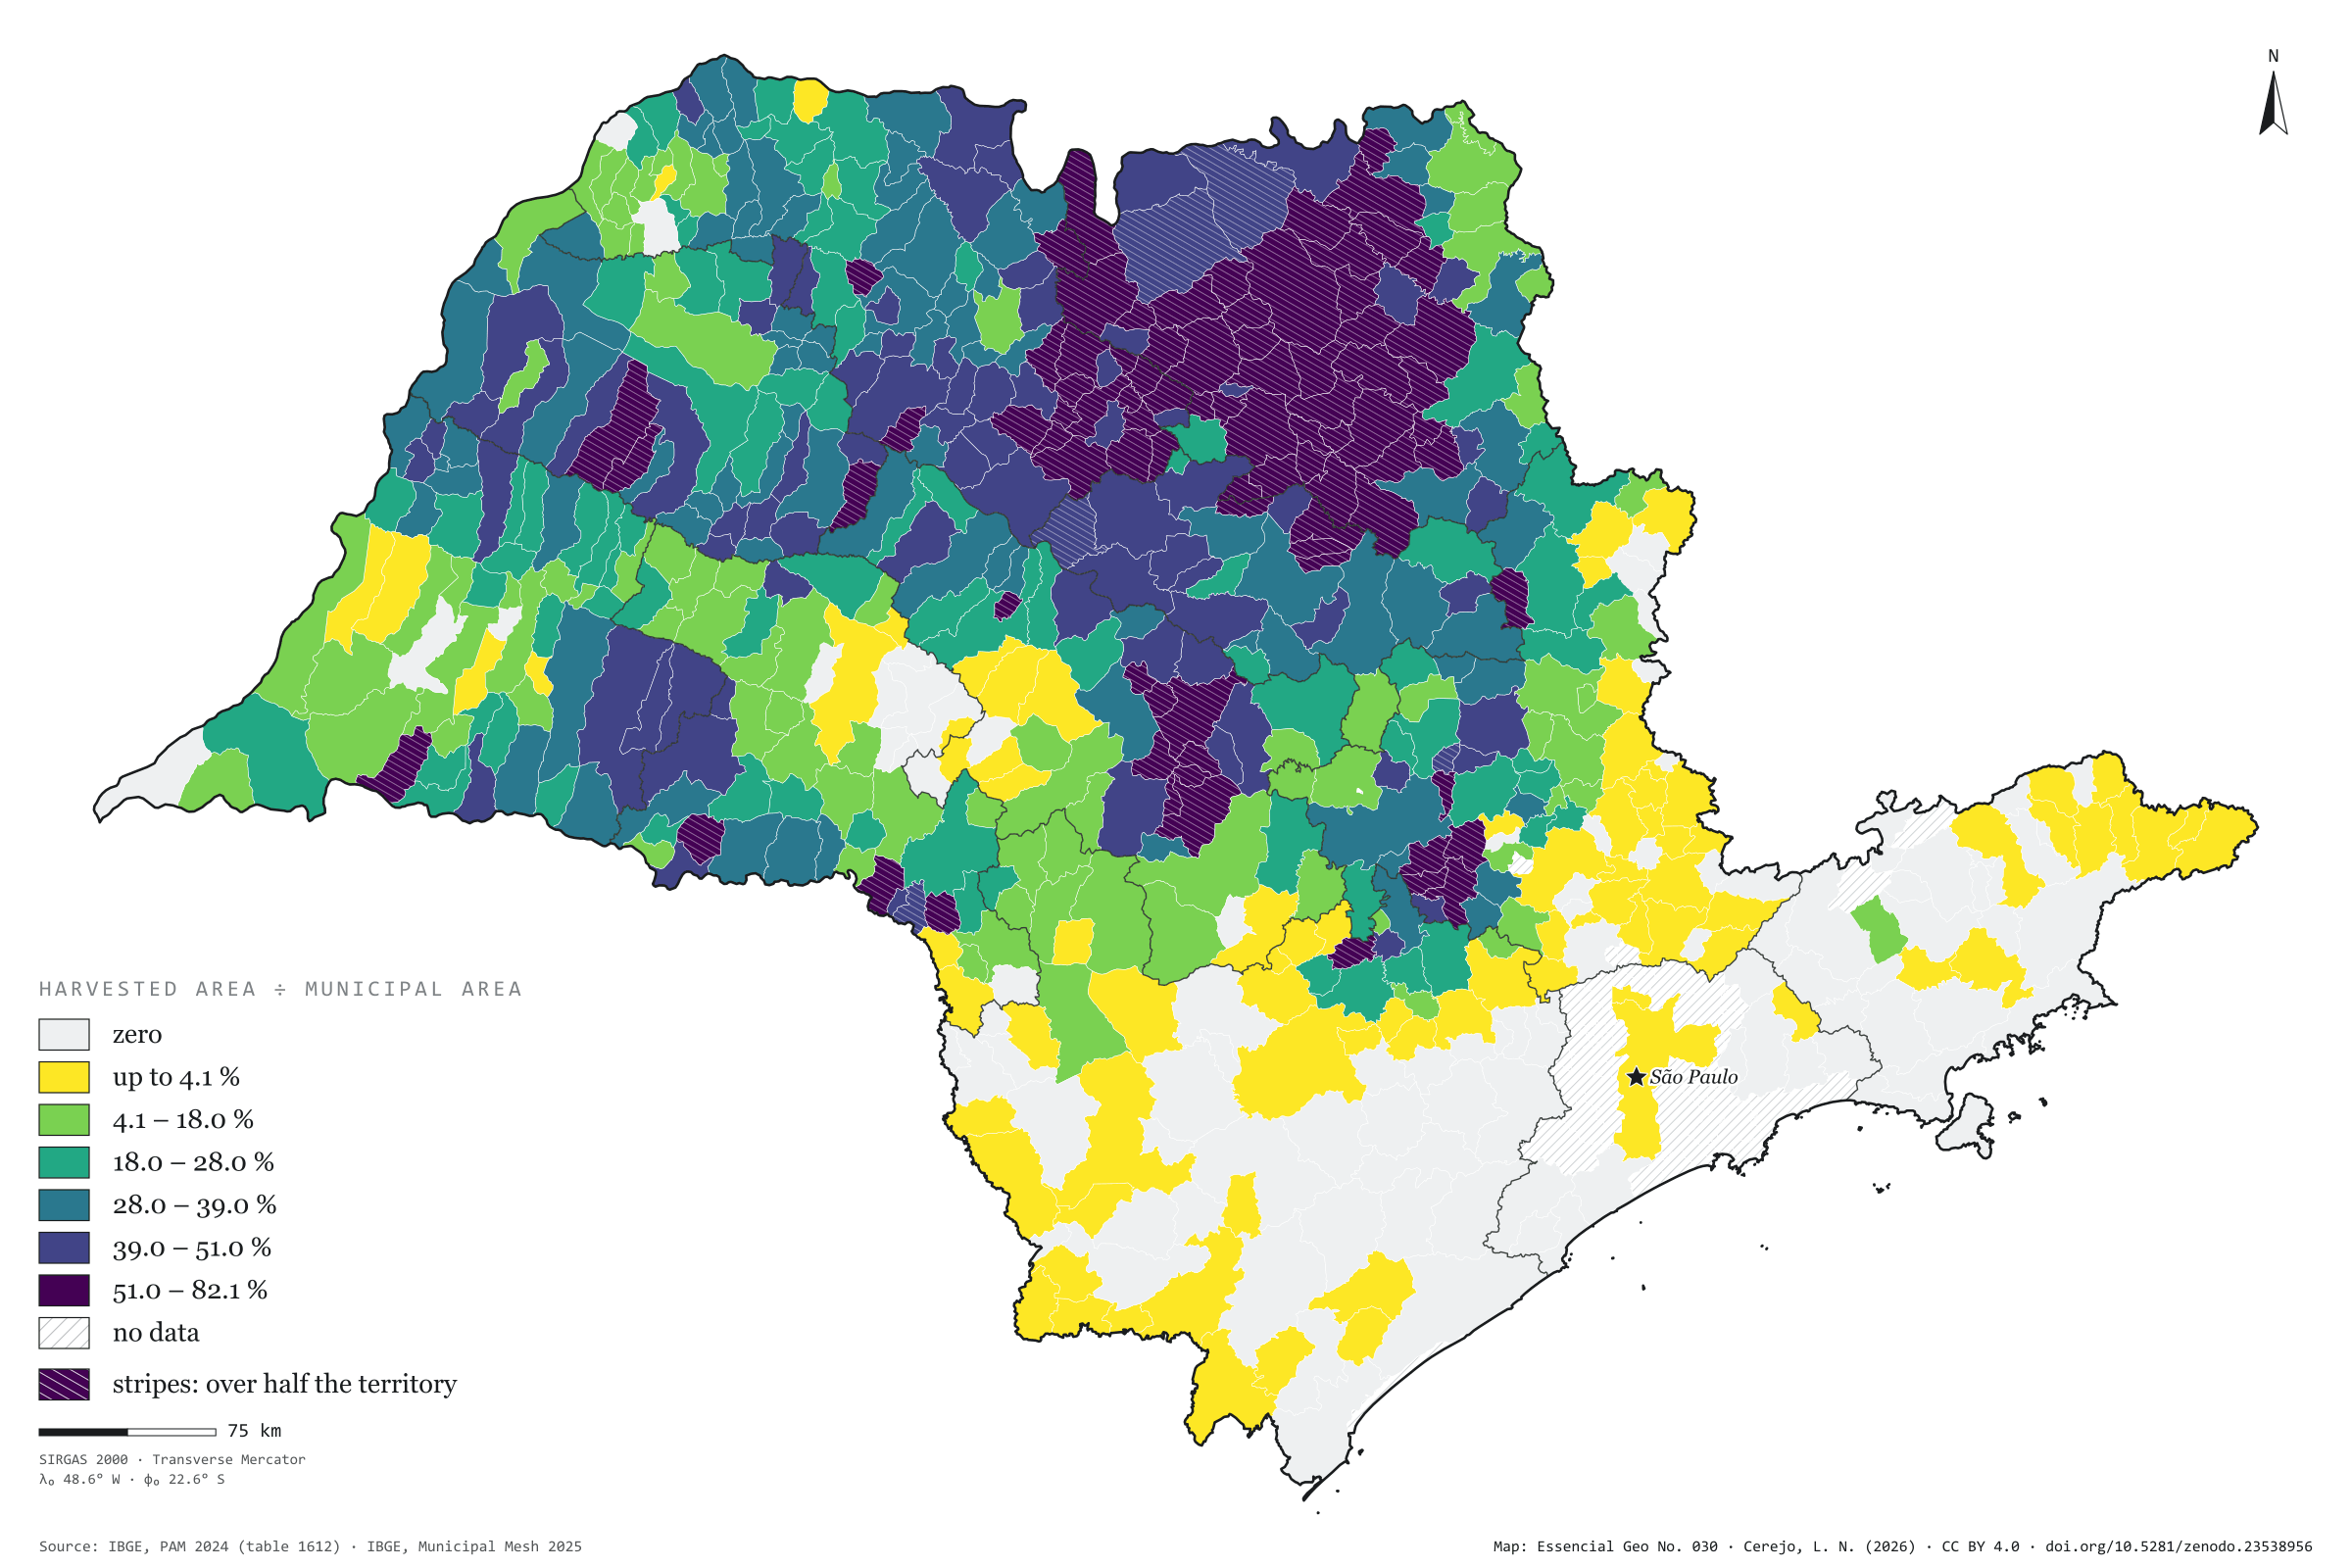
In 2024, São Paulo’s cane fields were harvested over 5.40 million hectares, 21.7% of the state, and yielded 418.6 million tonnes of cane. In 88 municipalities the harvested area exceeds half the territory; in Areiópolis it reaches 82%, and in Jaboticabal 81%. The map shows the dark patch that covers the north and centre of the state and has Morro Agudo as its largest producer (7.0 million tonnes), and it shows where the patch ends: in the Paraíba valley, the Ribeira valley and Greater São Paulo, cane all but disappears. Every tonne harvested leaves bagasse and straw, and every litre of ethanol leaves vinasse; this is the map São Paulo’s bioenergy rests on. Third plate of the collection “Bioenergy in São Paulo”.
Technical record · downloads · citation
At a glance
Harvested area
5,398,676ha
21.7% of the state’s territory; 508 municipalities with harvested cane
Production
418,569,112t
In 88 municipalities, harvested cane covers more than half the territory
Largest producers (t)
Morro Agudo6,974,210
Barretos6,452,296
Guaíra5,207,000
Jaboticabal4,719,100
Rancharia4,650,776
Layers
municipiospolygon645 municipalities: harvested area (ha), production (t), share of territory (%) and yield (t/ha)
regioes_intermediariaspolygon11 intermediate geographic regions
Harvested area and production of sugarcane from PAM 2024 joined to the Municipal Mesh by IBGE code; harvested area divided by municipal area, in six quantile classes.
The map without a frame, with legend, scale, reference system and credit written on it: ready for papers, lectures and slides. In two versions: with the basemap (neighbours and sea) or only the mapped area, on white.
CEREJO, Lucas Nakamura. Cana-de-açúcar: um mar verde sobre um quinto do estado. Versão 1.0.0. [S. l.]: Zenodo, 2026. Conjunto de dados. DOI: 10.5281/zenodo.23538956. Disponível em: https://doi.org/10.5281/zenodo.23538956. Acesso em: 10 nov. 2026.
Cerejo, L. N. (2026). Cana-de-açúcar: um mar verde sobre um quinto do estado [Sugarcane: A green sea over a fifth of the state] (Version 1.0.0) [Data set]. Zenodo. https://doi.org/10.5281/zenodo.23538956
@dataset{cerejo2026_cana_de_acucar_sp,
  author    = {Cerejo, Lucas Nakamura},
  title     = {Cana-de-açúcar: Um mar verde sobre um quinto do estado},
  year      = {2026},
  publisher = {Zenodo},
  version   = {1.0.0},
  doi       = {10.5281/zenodo.23538956},
  url       = {https://doi.org/10.5281/zenodo.23538956},
  language  = {portuguese},
  note      = {English title: Sugarcane: A green sea over a fifth of the state. Licence CC BY 4.0}
}
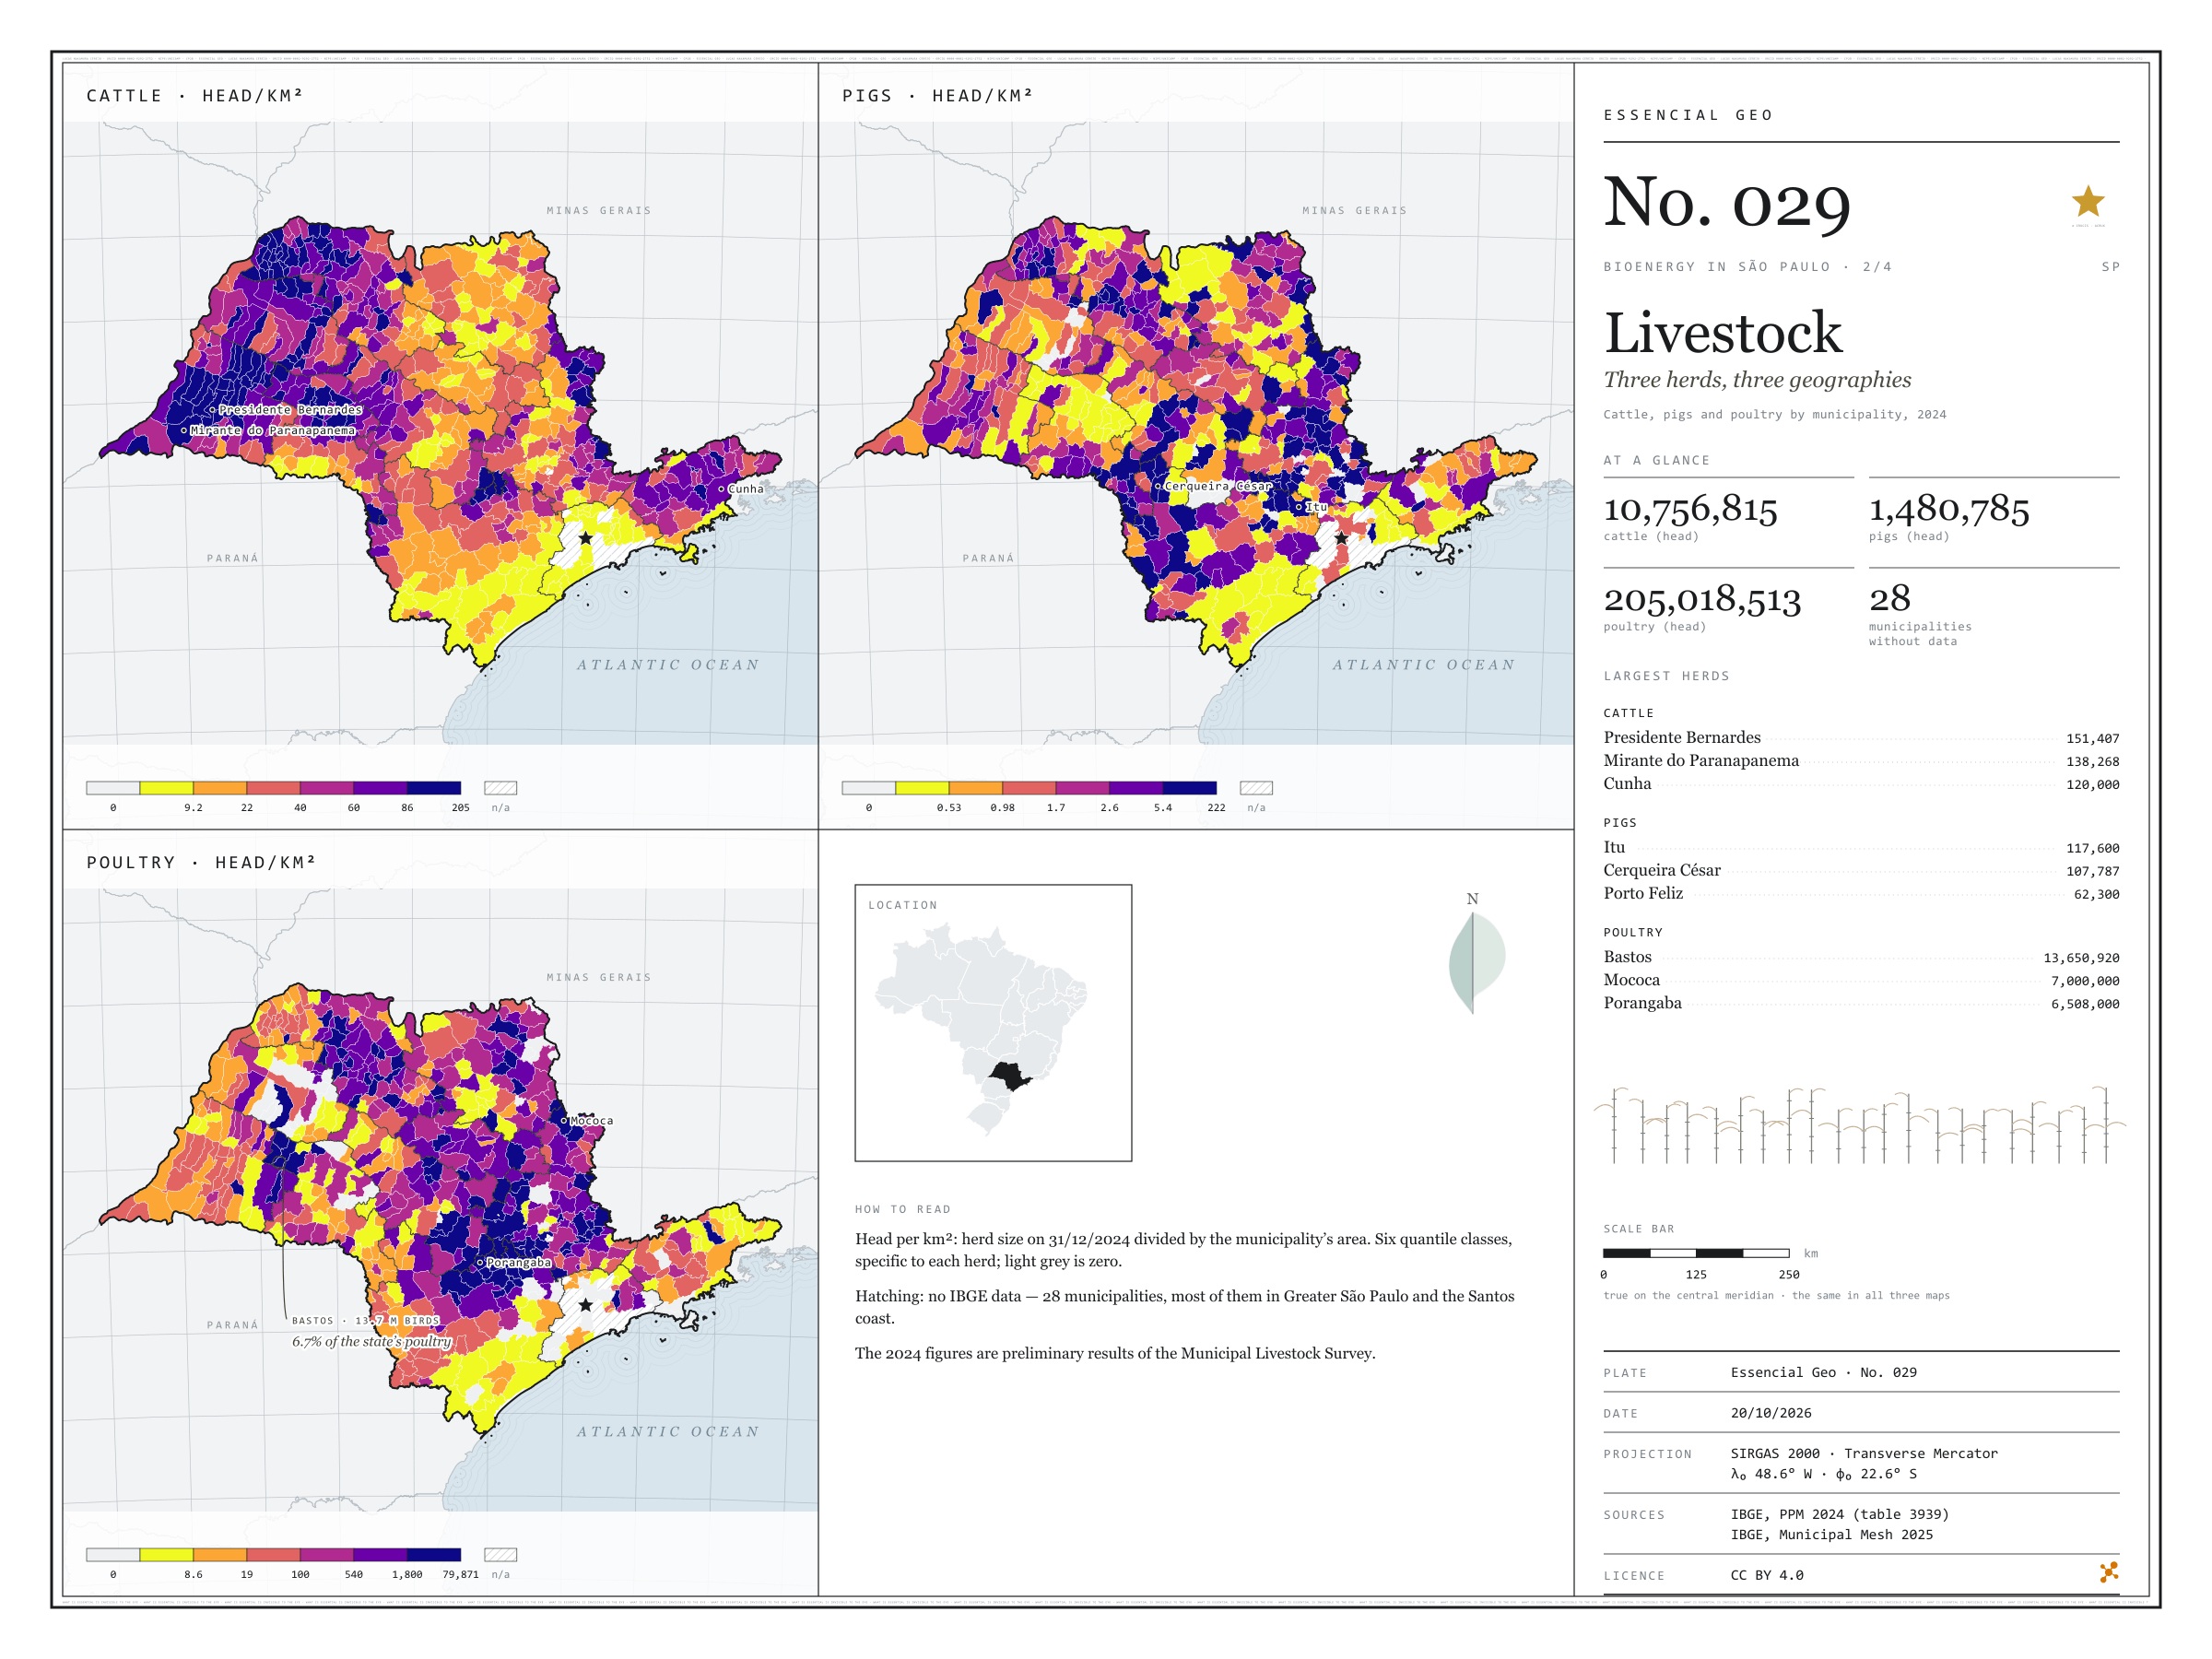
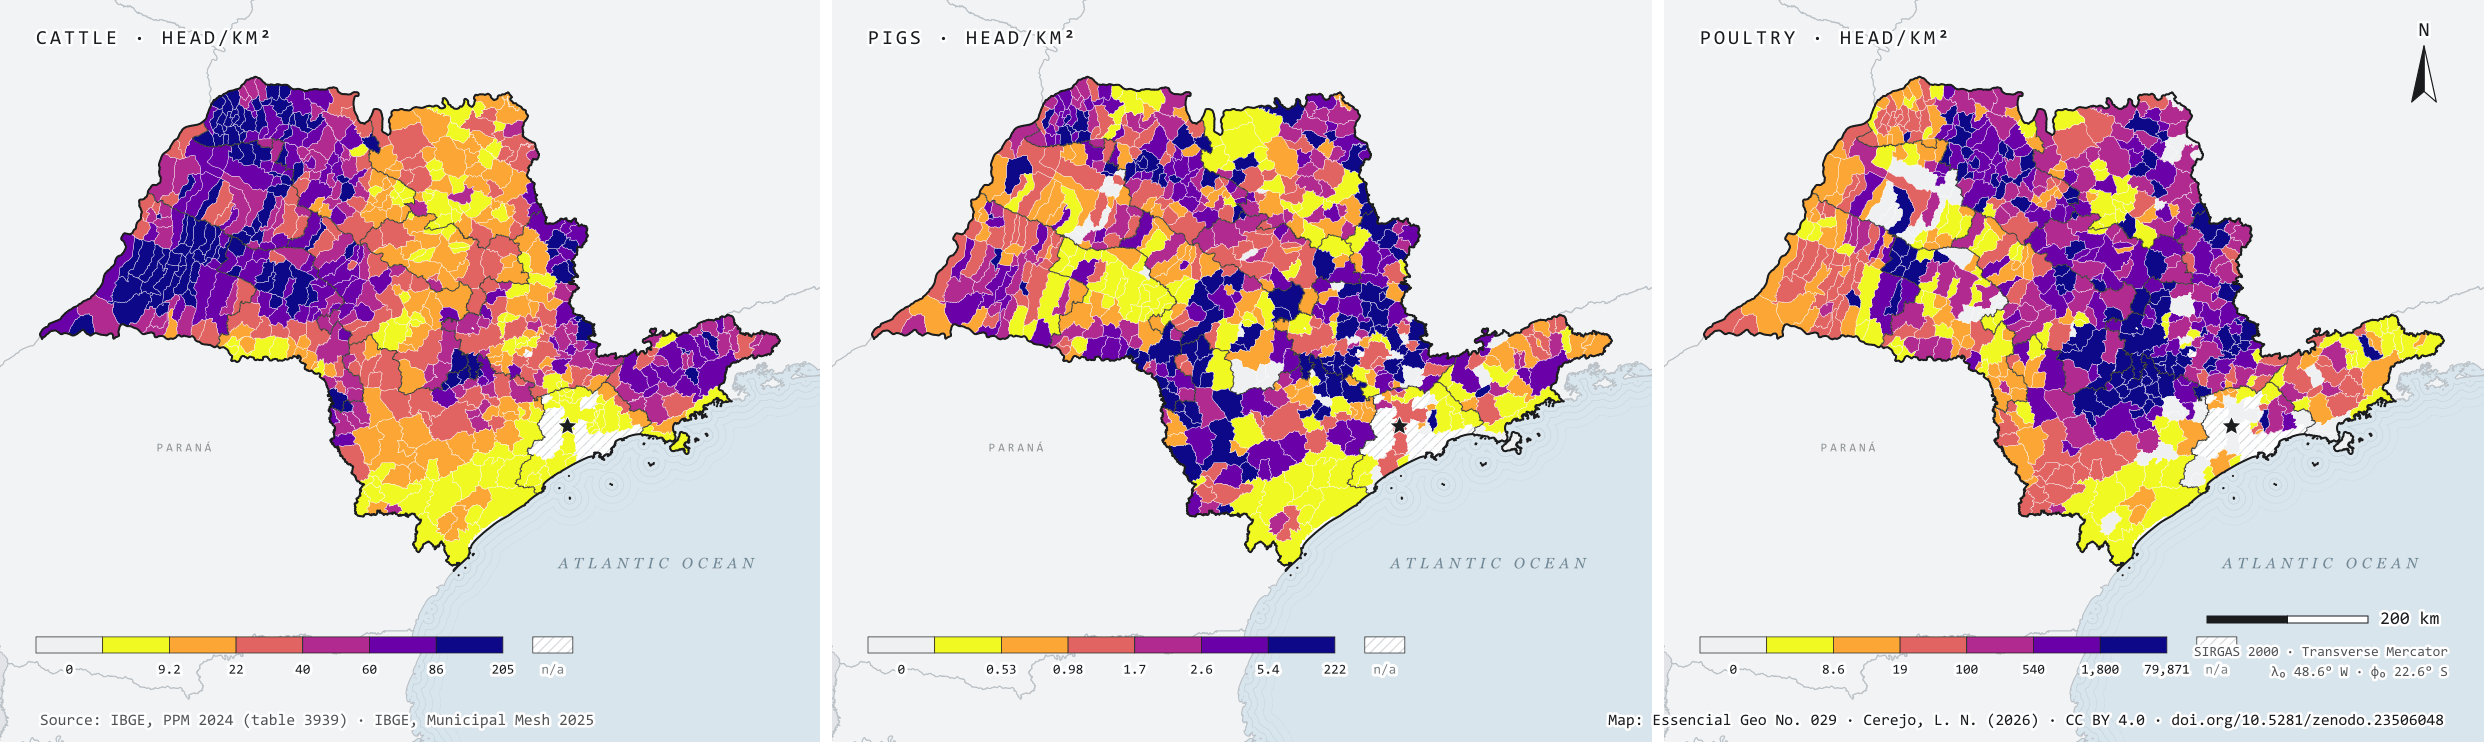
In 2024, São Paulo state held 10.8 million cattle, 1.5 million pigs and 205 million poultry. Side by side, the three herds occupy the state in different ways: cattle spread across the west, led by Presidente Bernardes (151,407 head) and Mirante do Paranapanema (138,268); pigs gather in a few hubs, such as Itu and Cerqueira César, each with over 100,000 head; and poultry cluster in farms, with Bastos alone holding 13.7 million birds. For anyone thinking about biogas, density matters more than the total: many animals on little land also concentrate the manure. Second plate of the collection “Bioenergy in São Paulo”.
Technical record · downloads · citation
At a glance
Cattle
10,756,815head
617 municipalities with cattle; largest herd: Presidente Bernardes (151,407)
Pigs
1,480,785head
584 municipalities with pigs; largest herd: Itu (117,600)
Poultry
205,018,513head
572 municipalities with poultry; largest flock: Bastos (13,650,920)
Layers
municipiospolygon645 municipalities: herd size and density (head/km²) of cattle, pigs and poultry
regioes_intermediariaspolygon11 intermediate geographic regions
The map without a frame, with legend, scale, reference system and credit written on it: ready for papers, lectures and slides. In two versions: with the basemap (neighbours and sea) or only the mapped area, on white.
CEREJO, Lucas Nakamura. Rebanhos: três rebanhos, três geografias. Versão 1.0.0. [S. l.]: Zenodo, 2026. Conjunto de dados. DOI: 10.5281/zenodo.23506048. Disponível em: https://doi.org/10.5281/zenodo.23506048. Acesso em: 10 nov. 2026.
Cerejo, L. N. (2026). Rebanhos: três rebanhos, três geografias [Livestock: Three herds, three geographies] (Version 1.0.0) [Data set]. Zenodo. https://doi.org/10.5281/zenodo.23506048
@dataset{cerejo2026_rebanhos_sp,
  author    = {Cerejo, Lucas Nakamura},
  title     = {Rebanhos: Três rebanhos, três geografias},
  year      = {2026},
  publisher = {Zenodo},
  version   = {1.0.0},
  doi       = {10.5281/zenodo.23506048},
  url       = {https://doi.org/10.5281/zenodo.23506048},
  language  = {portuguese},
  note      = {English title: Livestock: Three herds, three geographies. Licence CC BY 4.0}
}